Chapter 1
Introduction – The New Age of Data-Driven Business
"Every company has big data in its future, and every company will eventually be in the data business." — Thomas H. Davenport
In this chapter, we explored how data has become the lifeblood of modern commerce and a catalyst for business transformation. Today’s companies are operating in an unprecedented data-rich environment and those that harness this torrent of information can gain significant competitive advantages. The drivers behind this shift (from technological advances like AI and IoT to the pressing threat of digital-native competitors) and presented compelling evidence that data-driven decision-making leads to superior performance, innovation, and agility. Key pillars of becoming a data-driven organization were outlined, including fostering a data-centric culture, investing in analytics technology and talent, instituting strong data governance, and aligning data initiatives with business strategy. We provided practical guidance for executives on how to initiate and scale data-driven transformation – emphasizing starting with clear business goals, securing quick wins, and managing cultural change that demonstrate data’s power to inform strategy and delight customers. In conclusion, the chapter underscored that embracing data is no longer optional but mission-critical: companies that effectively leverage data as a strategic asset can adapt faster, make smarter decisions, and thrive in the new age, whereas those that neglect this shift risk being left behind.
1.1. Introduction: The Data-Driven Imperative
Data now underpins the fundamental architecture of commerce in ways that parallel—and in some cases exceed—past industrial transformations. Economists have long recognized the critical role of information in shaping competitive advantage, yet the advent of the digital era has amplified this principle exponentially. Modern enterprises generate and capture data at unprecedented scales, extending across every facet of the value chain—from customer interactions and supply chain logistics to financial forecasting and product innovation. This eruption of data, projected to exceed 175 zettabytes by 2025 (OneData AI Insights, 2025), has become a driving force behind strategic differentiation, compelling organizations to reorient themselves around analytic insights as a primary source of value creation. Industry voices underscore that it is no longer sufficient to implement data as a mere operational resource; rather, executives must view data as a strategic asset capable of redefining market positions and catalyzing novel business models (Business Case Studies, 2024).
In academic discourse, the importance of data has been framed within theories of resource-based advantage, suggesting that data is akin to a rare, inimitable asset that can be mobilized to sustain competitive superiority. Researchers draw parallels to established strategic frameworks such as the VRIO model—where resources must be Valuable, Rare, Inimitable, and Organized—to demonstrate how robust data infrastructures and advanced analytics capabilities fulfill these criteria. When harnessed effectively, data not only reveals patterns and associations previously hidden by traditional market research methods, but also positions organizations to pivot rapidly in response to dynamic consumer expectations (Barton and Court, 2013). As a result, companies equipped with cohesive data architectures often display a higher degree of agility and resilience in volatile markets, surmounting challenges by basing decisions on empirically grounded insights rather than intuition alone.
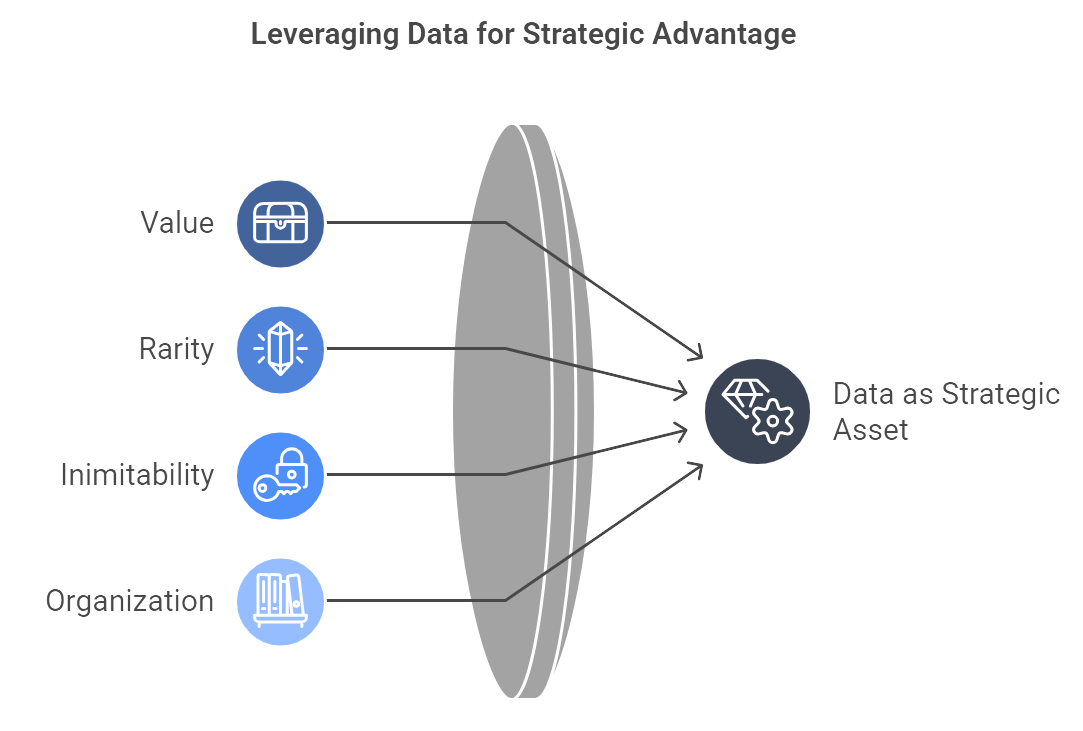
Figure 1: Illustration of how the VRIN framework (Valuable, Rare, Inimitable, Non-substitutable) applied to data, highlighting the four key attributes that establish data as a strategic asset for achieving competitive advantage. (Image by Napkin).
From an industry standpoint, the trajectory toward data-centric practices mirrors significant tipping points in business history, such as the introduction of mass production or the widespread adoption of the internet. Each of these milestones reshaped market boundaries and rewarded those who adapted quickly. Today, digitally native firms are able to scale analytics infrastructures, experiment with sophisticated machine learning models, and integrate real-time data streams into their core operations in a fraction of the time it took traditional enterprises to build comparable capabilities. This streamlined process is, in part, driven by advancements in cloud computing and artificial intelligence platforms, which reduce cost and complexity barriers (Atlan Insights, 2023). The upshot is a leveling of the playing field across sectors—large incumbents and agile startups alike can exploit data to enhance personalization, optimize supply chains, and launch data-driven services that respond to emerging customer demands.
Yet it’s worth pausing for a brutally honest moment: many organizations still treat “data-driven strategy” like an overhyped buzzword, slapping it onto every corporate memo without a clear plan. The difference between puffery and real data-driven transformation is almost comically vast—akin to the difference between announcing you’ll climb Mount Everest next week and actually making it to base camp with the right gear. Waving around the word “analytics” doesn’t magically fix entrenched processes or incompetent data handling. To truly leverage data, executives must champion cultural shifts, champion cross-functional teams, and—dare we say it—allocate appropriate budgets and talent. Wishful thinking, after all, does not produce an algorithm.
Recognizing data’s transformative power, both scholars and consultants have contributed frameworks to guide executives in operationalizing analytics. One widely accepted approach is the “data maturity model,” which maps an organization’s progression from ad-hoc, siloed analytics initiatives to a fully integrated, enterprise-wide data strategy. Typically, such models begin with basic reporting and descriptive analytics (think: “How many sales did we make last quarter?”), followed by diagnostic and predictive tools (e.g., “Why are our sales dropping in Region X, and how can we forecast future demand?”), culminating in prescriptive analytics and automated decision-making (imagine inventory management systems that restock themselves without human intervention). The progression requires not just technological investments in data management systems and analytical platforms, but also cultural and structural shifts that embed analytics into everyday workflows (Davenport and Harris, 2007).
Under this lens, data maturity becomes a marker of how thoroughly data has been woven into the organizational fabric. At the highest levels of maturity, data literacy is ubiquitous—from frontline employees to senior leaders who can interpret and act on data with confidence (and minimal drama). Indeed, early research suggests that firms attaining higher levels of data maturity often see improved operational efficiency, better alignment between strategic objectives and day-to-day tasks, and a stronger capacity to predict market movements and consumer trends (MIT Sloan Management Review, 2020). These advantages, however, do not materialize without deliberate effort. It’s one thing to buy a shiny new analytics platform; it’s quite another to ensure people across the organization know how—and are willing—to use it.
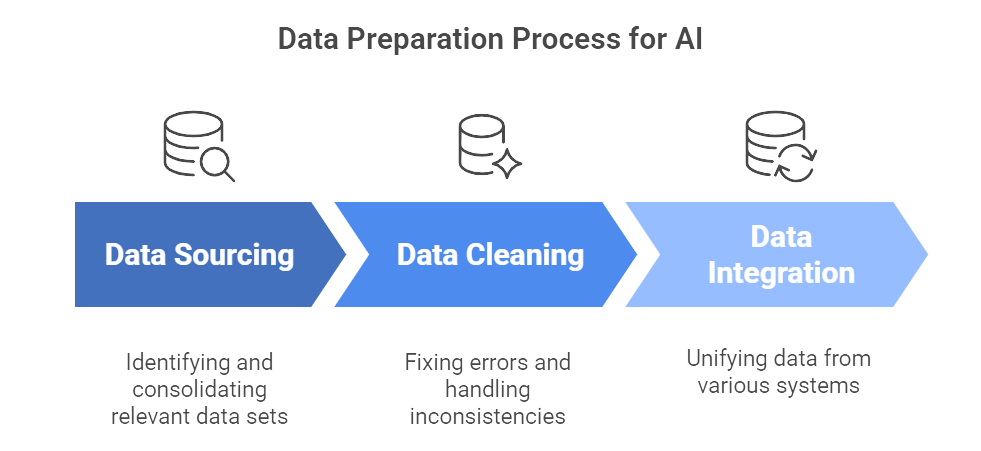
Figure 2: Illustration of the data preparation process for AI involves sourcing, cleaning, and integrating data for optimal performance. (Image by Napkin).
Skimp on these foundational steps and you risk ending up with “garbage in, garbage out”—a phenomenon that can quickly erode any trust in the data and, by extension, any initiative labeled “data-driven.”
Once data is reasonably reliable, analysts and data scientists can engage in exploratory data analysis (EDA)—essentially poking around to see what interesting patterns or anomalies surface. Simple techniques (e.g., histograms, scatter plots, correlation checks) can unearth powerful insights. EDA often reveals immediate opportunities—like a particularly profitable customer segment you’ve never marketed to effectively—or potential pitfalls, such as hidden biases in your data that could sabotage more advanced modeling efforts later on.
Early analytics initiatives often start with descriptive statistics—counting how many widgets were sold last week, measuring average response rates to email campaigns, and so on. This is Analytics 101, the “look in the rearview mirror” approach that, while useful, doesn’t necessarily help you steer the car around the next corner. The real excitement (and business value) begins with predictive and prescriptive analytics.
Predictive Analytics: Uses historical data to build models (often machine learning) that forecast future outcomes—like which customers are likely to churn.
Prescriptive Analytics: Recommends specific actions—think complex optimization algorithms for supply chain routing or dynamic pricing strategies for e-commerce platforms.
Machine learning takes center stage when large volumes of complex data require pattern recognition beyond human capabilities. Traditional algorithms (like linear regression or decision trees) can handle structured data fairly well; more advanced techniques (e.g., random forests, gradient boosting) can capture non-linear relationships with higher accuracy. Deep learning steps in when data gets more unstructured—like images, audio, or text. Neural networks can unearth subtle and high-dimensional patterns, fueling technologies from facial recognition to recommendation systems.
But here’s the honest truth: implementing these advanced techniques without a solid business case or well-defined metrics is a recipe for “AI theater.” It might look good for a keynote speech or investor pitch, but if it doesn’t integrate into real workflows and show measurable results, it’s all for show. Too often, executives chase AI hype without considering whether simpler methods might achieve the same objective more cost-effectively. The moral? Get the basics right before scaling up to the rocket science.
A particularly hot topic is real-time analytics, where data from sensors, transactions, or user interactions is processed instantly for on-the-fly decision-making. Imagine an online retailer that adjusts product recommendations the moment a shopper clicks on a new category—or a logistics company rerouting trucks based on real-time traffic data. This capability can unlock competitive advantages by improving customer experiences (fewer out-of-stock items) and operational efficiency (less wasted time, fewer idle resources).
However, it’s not always as easy—or as necessary—as vendors make it sound. Streaming analytics platforms and low-latency infrastructures can be expensive to implement and maintain. Plus, if your business doesn’t truly need second-by-second updates (do you really need to monitor sales metrics in real time if you’re only adjusting inventory monthly?), you might be over-engineering a solution. Again, strategy comes first, technology second.
No modern conversation on data would be complete without touching on the ethical and regulatory minefields of AI. As more companies adopt machine learning models for decisions ranging from credit approvals to hiring, concerns about algorithmic bias and lack of transparency have soared. Regulatory bodies worldwide have begun crafting guidelines around AI fairness, data protection (think GDPR), and consumer privacy. It’s one thing to make a bold claim that your model improves efficiency by 20%. It’s another to prove it doesn’t inadvertently discriminate against certain demographic groups or violate privacy standards.
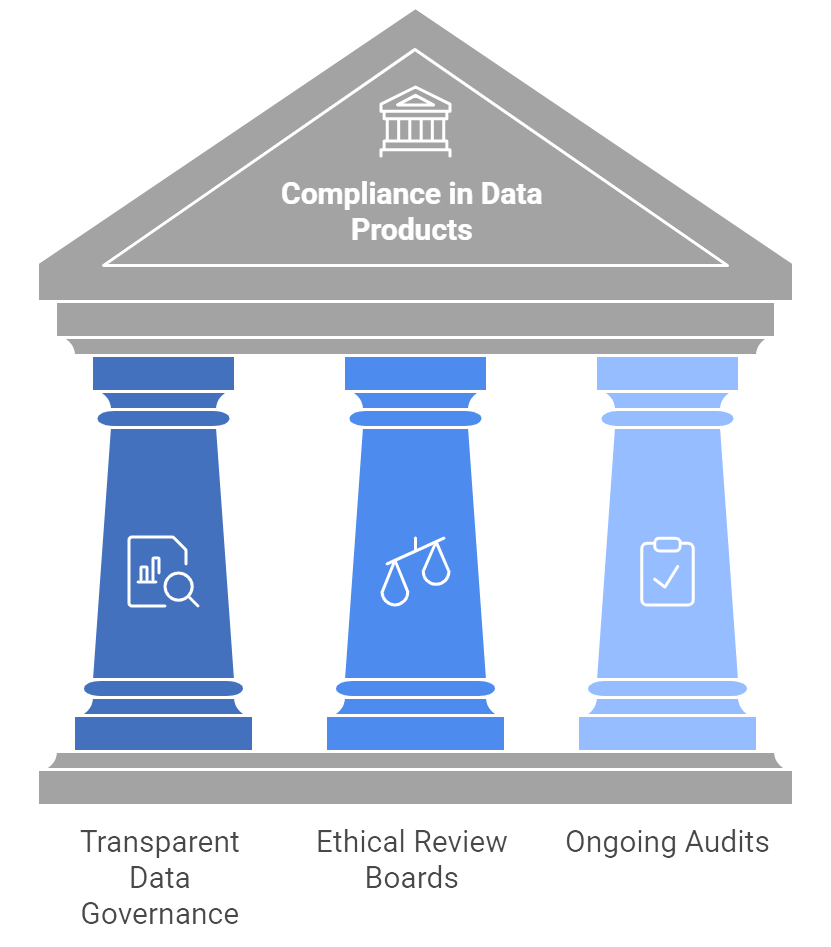
Figure 3: Illustration of how to make sure data products are used responsibly. It's like a temple built on three things: being open about how data is used, having ethical reviews, and checking things regularly. (Image by Napkin).
Executives must ensure compliance is baked into the design of data products rather than bolted on as an afterthought. This requires:
Transparent Data Governance: Clear policies on who can access data, for what purpose, and how it’s secured.
Ethical Review Boards: Cross-functional committees that review analytics initiatives to flag potential risks.
Ongoing Audits: Continuous monitoring of models to detect performance drifts or biases as real-world conditions change.
The cost of neglecting these considerations can be steep—ranging from reputational damage to legal penalties. If you’re wondering how quickly public sentiment can sour, just recall the fiascos of social media data misuse. As the saying goes, “With great power comes great responsibility”—and in this era, data is certainly a form of power.
Business leaders therefore confront a dual challenge: adopting the right technologies to capture and analyze data effectively, and fostering a corporate climate that prizes inquiry, transparency, and evidence-based reasoning. For many enterprises, the pivot to a data-centric model entails retraining staff, revising performance metrics to include data-driven outcomes, and rethinking governance protocols so that data privacy, security, and integrity remain paramount. In parallel, executives must articulate a clear strategic vision that elucidates how analytics initiatives align with broader business goals, ensuring that data-driven techniques reinforce, rather than distract from, core competencies.
At a practical level, this translates into cross-functional collaborations—data scientists might work alongside domain experts, product managers, and even marketing teams to ensure analytics solutions address real operational challenges. And yes, this can involve more meetings, more discussions about messy spreadsheets, and a fair bit of healthy conflict. But the outcome—integrated, actionable insights—usually justifies the headache.
In practical terms, data’s impact spans the full arc of strategic management, from high-level planning to granular operational refinements. Retailers leverage detailed purchasing histories and demographic insights to personalize marketing campaigns, reducing churn and boosting conversion rates. Logistics firms employ real-time tracking information and advanced optimization algorithms to cut transportation costs and improve delivery times. Financial institutions rely on predictive models to detect fraud and guide investment strategies, while healthcare providers use patient data and advanced diagnostics to enhance clinical outcomes and drive personalized care pathways. These divergent use cases share a common thread: the harnessing of data to refine decision-making, achieve efficiencies, and create novel products and services that can differentiate a firm in a crowded marketplace (Business Case Studies, 2024; Barton and Court, 2013).
Ultimately, data’s potency emerges not merely from the volume of information but from an organization’s capacity to glean strategic insights and convert them into concrete actions. Those that do so effectively can position themselves at the vanguard of innovation, attracting top talent and commanding market relevance in an era defined by rapid change. As the chapters ahead will illustrate, this evolution into data-driven commerce hinges on more than just technology; it is about cultivating a new organizational mindset that embraces experimentation, continuous learning, and rigorous analysis as core business practices (Davenport and Harris, 2007; MIT Sloan Management Review, 2020). When guided by strong leadership and integrated into the structural, cultural, and operational dimensions of the enterprise, data-based strategies become not simply additive, but transformative—fueling growth, competitiveness, and sustainability in a business landscape that increasingly prizes intellectual agility and adaptive foresight.
As you dive deeper into the chapters ahead, keep in mind that data science is not just the latest management fad. Done right, it reshapes how decisions are made at every level—often sparking a bit of chaos before achieving clarity. Yes, you’ll need to navigate office politics, quell territorial disputes between departments, and possibly learn to interpret the arcane jargon of data scientists. But if you embrace these challenges—and invest in the necessary technology, talent, and cultural alignment—your organization can leverage data to continually innovate, outmaneuver competitors, and deliver real value to stakeholders.
In short, welcome to the data-driven era. It’s messy, it’s exciting, and it’s absolutely essential for commercial success in the twenty-first century. Buckle up—and get ready to discover how data science, executed with both strategic vision and operational discipline, can redefine what’s possible for your enterprise.
1.2. Why Now? Drivers of the New Data Age
At a glance, the impetus for data-driven transformation might appear obvious—every CEO and board member on the planet now claims to be “data-obsessed.” Yet the real story of why this shift is happening right now is more nuanced. It’s rooted in a confluence of technological, market, and regulatory forces that have collectively accelerated data’s transition from being a forgotten byproduct of business transactions to a mission-critical resource. Academics, industry analysts, and consultants have all weighed in, highlighting that while information asymmetry has long been a source of competitive advantage, the game has changed dramatically with the advent of large-scale digital capture, cheap data storage, and powerful analytic tools.
The widespread digitization of every sector—retail, healthcare, finance, and beyond—has unleashed torrents of information that were once inaccessible or too fragmented to be useful (NewVantage Partners, 2020). Consumers now shop, bank, and entertain themselves online, generating a constant stream of clicks, views, and transactions. The Internet of Things (IoT) and sensor technologies multiply these data flows, providing real-time updates on everything from warehouse operations to medical devices. Meanwhile, social media platforms and specialized external data providers reveal public sentiment and market trends that were previously buried in anecdotes or guesswork. This shift to all-things-digital has turned data—once a low-priority byproduct—into a critical raw material that can spark innovation, boost efficiency, and drive deeper customer engagement. In other words, if your organization still dismisses data as “that stuff the IT department handles,” you’re already losing ground to competitors who see it as the strategic backbone of their business model.
From an industry perspective, the cost of data storage and processing has dropped so sharply that it borders on comical to recall what was spent on servers and enterprise software licenses ten or fifteen years ago. Cloud computing advances and the rise of pay-as-you-go (or pay-as-you-grow) models mean even mid-sized or smaller organizations can implement robust data infrastructures without incurring immense capital expenses. Open-source tools like Hadoop and Spark have also trimmed software budgets, while an abundance of SaaS vendors offer specialized solutions for data visualization, analytics, and streaming on a subscription basis. Barton and Court (2013) point out that this democratization of advanced analytics has not only empowered startups and smaller contenders to challenge established players, it has also obliterated many of the traditional excuses bigger firms once used to avoid serious data initiatives. When the technology is both accessible and affordable, the real obstacles typically come from organizational culture or leadership inertia.
Many markets are now shaped by digital natives like Netflix, Amazon, and Alibaba, which have set a high bar by integrating real-time analytics, personalized consumer insights, and agile development practices right into their organizational DNA. Their customers expect nothing less than instant service and hyper-personalized product recommendations. These rising expectations trickle down to every other industry, forcing legacy players to modernize or fade into irrelevance. McKinsey Quarterly (2013) stresses that the competitive tempo has accelerated, and so has the technological evolution fueling it. Traditional business models are coming under pressure from nimble upstarts that can leverage data to adapt quickly, customize at scale, and operate efficiently on slimmer margins. In this environment, data analysis is no longer a peripheral function; it has become a central driver of product differentiation, cost management, and strategic decision-making.
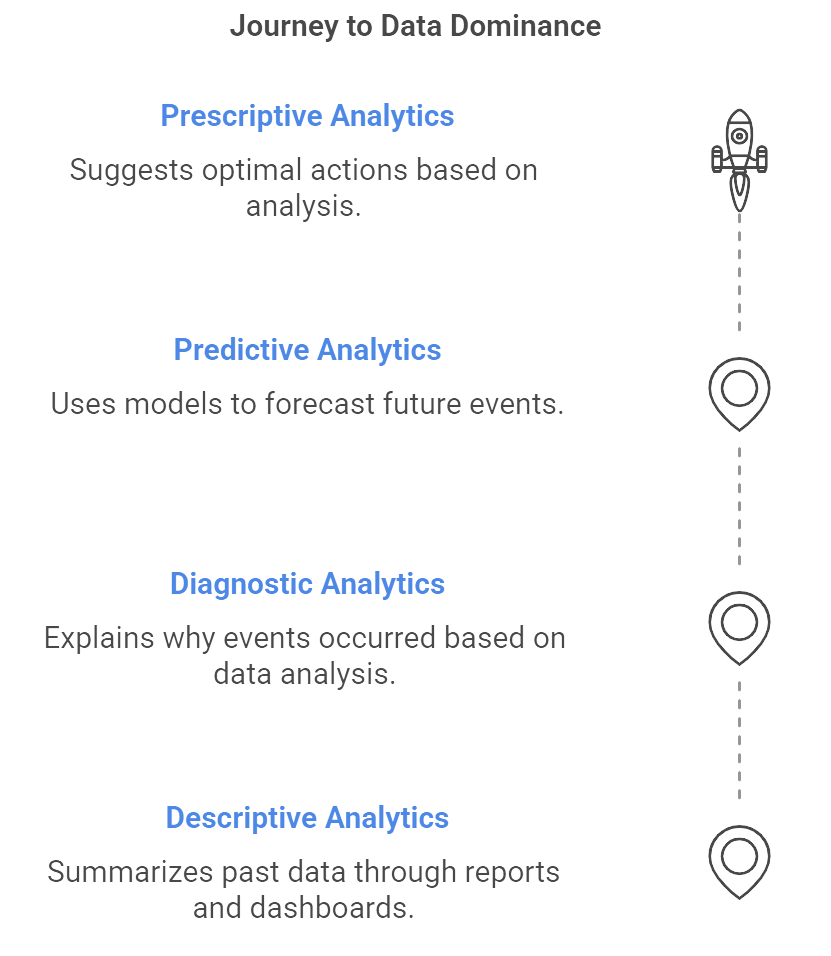
Figure 4: Ilutsration of of the evolution of data analytics, highlighting the increasing complexity and value from descriptive to prescriptive. (Image by Napkin).
Academic literature offers conceptual frameworks to help organizations move from initial data dabbling to full-scale data dominance. One prominent model is the Data Maturity Curve, which describes an organization’s evolution from basic descriptive analytics to advanced predictive and prescriptive capabilities. Descriptive analytics focuses on what happened—monthly sales reports, website traffic dashboards, or churn rate metrics. Diagnostic analytics explains why it happened, leveraging methods like segmentation, correlation analysis, and root-cause discovery. Predictive analytics, which uses machine learning models to anticipate future events, marks a shift toward forecasting outcomes such as demand fluctuations or customer churn. Prescriptive analytics goes even further by suggesting or automating optimal actions in areas like pricing strategies or resource allocation. According to Davenport and Harris (2007), three foundational pillars—technology, talent, and culture—are essential for progressing along this curve. It is not enough to invest in servers, software, and technical specialists; leadership must also foster a culture that prizes data-driven decision-making and welcomes the transparency such decisions introduce.
Another influential factor in the new data age is the increasingly complex regulatory environment surrounding data usage. The introduction of the European Union’s General Data Protection Regulation (GDPR) and similar laws worldwide has forced companies to manage consumer information with meticulous care, placing stringent controls on how personal data is collected, stored, and shared. Atlan Insights (2023) underscores that, while robust data governance can feel like a hindrance in the short term, it ultimately fosters consumer trust and safeguards an organization’s brand reputation. If mishandling data can lead to severe fines and public outrage, then establishing transparent governance protocols becomes a strategic imperative. In this climate, governance frameworks that protect data privacy and security also boost the overall quality of analytic output by assuring decision-makers that data is accurate, compliant, and well-managed.
The rapid advancement of machine learning and AI compounds the competitive stakes. Deep learning methods used for image recognition, natural language processing, and complex pattern discovery were once considered esoteric. They are now within reach for most enterprises, granting the ability to predict consumer behavior, detect anomalies in supply chains, and enhance risk management systems in finance. OneData AI Insights (2025) points out that ignoring these advanced techniques can be perilous, as early adopters quickly build so-called “data moats” that become formidable barriers for slower-moving competitors. Machine learning models thrive on abundant data, refining their algorithms with every iteration. Organizations that delay investing in these capabilities may soon find themselves outmaneuvered in areas like targeted marketing, fraud detection, and real-time process optimization.
Although technology adoption poses significant challenges, data initiatives often stumble over human and organizational factors more than purely technical ones. NewVantage Partners (2020) identifies executive vision and cultural buy-in as two of the most formidable barriers. Transforming a company into a data-driven enterprise necessitates leadership that not only articulates a clear strategy but also backs it up with consistent policies, incentives, and resource allocations. Mid-level managers and frontline employees must see that data-based insights align with their performance metrics and daily workflows. Without a unifying vision—reinforced by tangible changes in how decisions are made—data teams can end up in silos or churning out reports that nobody reads. Successful transformation also hinges on cross-functional collaboration, as data scientists need input from domain experts in finance, marketing, supply chain, or human resources to ensure insights are actionable.
In a climate of heightened competition, the cost of inaction has a dual dimension. In the short term, organizations may miss opportunities to capitalize on data-driven insights that could boost efficiency, revenue, or customer satisfaction. Over a longer horizon, they risk widening the capability gap relative to data-savvy rivals. Firms that lag in adopting machine learning or AI often discover that catching up is increasingly expensive because competitors have already refined their algorithms with more data and feedback loops. Mismanaging data privacy and security can also spiral into legal troubles, brand erosion, and a dramatic loss of consumer trust. Meanwhile, public and regulatory scrutiny of ethical AI and data usage is intensifying, and companies that fail to address these concerns face a different sort of risk—the backlash of public opinion.
Forward-thinking organizations are now weaving analytics into everyday operations, whether in route optimization for logistics, personalized retail promotions, or financial risk modeling. This cumulative embrace of data yields a business model primed for continuous learning and resilience, traits that are increasingly indispensable for navigating market disruptions and changes in demand (NewVantage Partners, 2020). In the coming chapters, we will delve deeper into how to operationalize data-driven practices, from the unglamorous essentials of data cleaning and integration to the deployment of advanced machine learning and real-time analytics. We will also explore strategies for executives to drive cultural transformation, ensuring that data initiatives are not relegated to the status of pet projects but become enduring catalysts for competitive advantage. Data may be the new frontier of business, but it is leadership, alignment, and strategic execution that will determine whether organizations merely dabble in analytics or truly leverage its transformative potential.
1.3. The Value of Data-Driven Decision Making
Data has evolved into an essential strategic asset because it now underpins nearly every facet of organizational decision-making, from everyday operational tweaks to high-stakes strategic pivots that can determine a firm’s survival. Scholars argue that data-rich environments allow leaders to align decisions directly with verifiable insights, minimizing the infamous gut-feel biases and “executive hunches” that sometimes steer companies off track (RIB Software Blog, 2024). Industry giants echo this academic perspective, emphasizing that the ability to parse real-time data enables them to swerve around looming disruptions, recalibrate strategies on the fly, and pounce on market opportunities before rivals even realize what’s happening (McKinsey Quarterly, 2013). This emphasis on proactive rather than reactive leadership reflects a deepening shift in management mindsets: data has become much more than a helpful input—it is the central catalyst that reshapes corporate thinking, collaboration, and innovation.
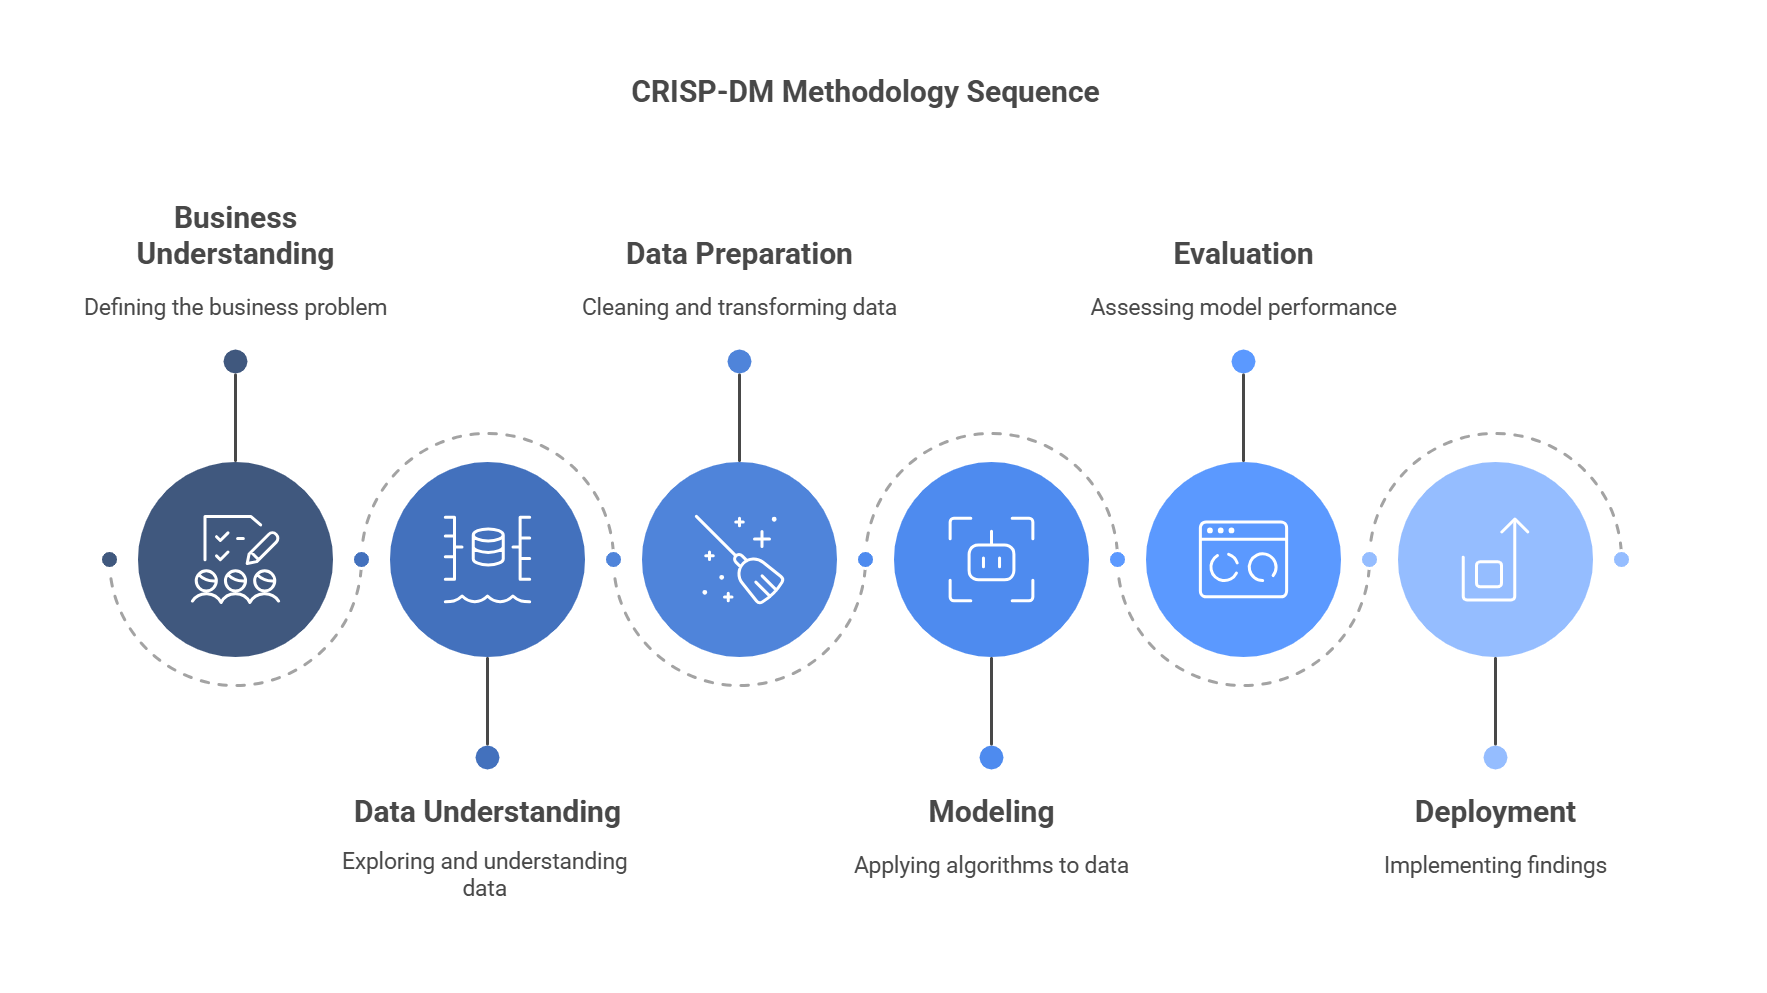
Figure 5: Illustration of a structured flowchart detailing the six CRISP-DM phases that transform raw data into actionable business insights. (Image by Napkin).
Expanding from basic analytics to advanced approaches requires a clear roadmap, and one of the most widely recognized frameworks guiding data-driven initiatives is the CRISP-DM (Cross-Industry Standard Process for Data Mining) methodology. Originally developed in the late 1990s by a mix of industry leaders and academics, CRISP-DM breaks the analytic journey into six sequential stages—Business Understanding, Data Understanding, Data Preparation, Modeling, Evaluation, and Deployment. This structured, iterative cycle helps organizations transform raw data into insights that genuinely matter. Its power lies in linking the technical aspects of data analysis to specific business objectives, thus avoiding the costly pitfall of disjointed, one-off projects that neither scale nor align with strategic goals.
The Business Understanding phase is where leadership teams define the objectives, scope, and success criteria of an analytics initiative. Contrary to the popular misconception that “more data is always better,” this phase insists on clarity: which decisions will be improved by data, and how will we measure success? Once these questions are nailed down, the Data Understanding phase follows, requiring analysts and data scientists to scrutinize the origin, structure, and overall quality of the data. This often involves profiling distributions, detecting anomalies, and identifying missing values to ensure that any red flags are tackled early—before they morph into major project derailers.
Data Preparation comes next, involving what may be the least glamorous but most crucial set of tasks in the entire lifecycle. Cleaning, transforming, and merging data from diverse sources—often locked in archaic legacy systems—can be labor-intensive. However, any shortcuts here risk undermining the reliability of subsequent analyses. The Modeling phase then draws on a range of algorithms, from the tried-and-true (like linear regression or decision trees) to the more exotic (such as neural networks and ensemble methods). The iterative nature of CRISP-DM allows teams to home in on the best model by tuning parameters, recalibrating features, and continuously referring back to the project’s original business objectives. If a model passes muster in the rigorous Evaluation stage, it is finally ready for Deployment. This last step translates analytics into tangible applications such as real-time forecasting tools, user-friendly dashboards, or recommendation engines that frontline staff can apply daily.
CRISP-DM’s importance stretches beyond mere technical efficiency because it encourages a shared language and structure across departments. By bringing together domain experts, IT professionals, and executive stakeholders under one umbrella, this framework promotes organizational alignment and fosters a culture where data isn’t treated as a secret code known only to a few. Davenport and Harris (2007) highlight that structured, well-documented methodologies not only boost consistency and reliability, they also bake data-driven thinking into the company’s DNA. Over time, this encourages a culture of inquiry and evidence-based practice, a mindset that becomes vital for long-term success in a rapidly shifting market.
At a higher level, data-driven thinking intersects powerfully with established theories of organizational learning. Researchers have shown that businesses capable of systematically capturing, evaluating, and embedding new information into their operations learn faster from both home-run successes and spectacular flops. This “learn-it-all” culture is visible in industries such as retail, where data-fueled personalization can breathe new life into marketing campaigns, or logistics, where predictive route planning can dramatically trim transportation costs (Business Case Studies, 2024). In each case, iterative improvements accumulate, gradually reshaping the business model into one driven by continual testing and measurable outcomes.
Although CRISP-DM is a staple, it’s hardly the only conceptual tool that executives can draw on. Frameworks like the Balanced Scorecard have been adapted to incorporate data-centric KPIs, enabling firms to track not only financial metrics but also consumer, operational, and innovation-focused measures. By coupling these metrics with robust analytics systems, businesses can pivot more intelligently, adjusting priorities in near real time. Barton and Court (2013) refer to data as a “common language” that dismantles departmental silos and fosters synchronized decision-making across marketing, finance, and operations. In effect, data becomes a unifying force that propels collaboration.
Senior executives benefit equally from data-driven methods when making big-ticket strategic moves, such as acquisitions or capital-intensive expansions. Advanced predictive and prescriptive models can simulate various scenarios, clarifying potential risks and return profiles. This process helps leaders weigh their options more objectively and pivot quickly if new information suggests a different path. The stakes are especially high in volatile markets or crisis scenarios, where swift, factual decision-making can mean the difference between a hiccup and a meltdown. Firms that actively monitor consumer signals and operational indicators can reorganize product lines, tweak supply chains, or optimize staffing levels long before their competitors realize it’s time to change course (OneData AI Insights, 2025).
Research consistently confirms that companies committed to data-driven decision-making often post higher efficiency gains, stronger revenue growth, and more distinctive brand positioning. Business Case Studies (2024) reports that enterprises with embedded analytics programs can adapt more nimbly to shifting market conditions, while MIT Sloan Management Review (2020) emphasizes that weaving data analysis into core strategic processes produces superior resilience over the long haul. Atlan Insights (2023) further warns that culture is the real make-or-break factor. Even with state-of-the-art tech, stale mindsets or turf wars between departments can cripple analytics initiatives. An environment that celebrates learning, iteration, and occasional risk-taking is essential for sustaining the benefits of data.
Ultimately, adopting a data-driven ethos goes well beyond collecting vast quantities of information or cranking out the occasional report. Effective data strategies marry business objectives with a rigorous methodology, exemplified by frameworks like CRISP-DM, ensuring that every analytic endeavor, from the simplest KPI dashboard to the most sophisticated deep learning initiative, delivers genuine value. This disciplined approach prevents stagnation by pushing organizations to constantly refine their models in response to fresh evidence, sharpen strategic priorities through predictive insights, and uncover new revenue streams or cost savings that were previously hidden in plain sight. Whether an organization aims to target promising consumer segments, streamline global supply chains, or future-proof itself against abrupt market swings, the intelligent deployment of data can furnish a powerful competitive edge in the turbulent commercial arena of today (Atlan Insights, 2023).
Subsequent chapters will delve into the nitty-gritty of operationalizing these capabilities at scale. We will examine how to recruit the right talent, forge cross-functional collaborations, and build the robust governance structures necessary to handle privacy, compliance, and ethical quandaries. Because while data might be the new oil or the new gold—pick your favorite metaphor—neither oil nor gold magically converts into usable fuel or precious jewelry without skilled people, efficient processes, and a clear vision driving its refinement. The real challenge is converting raw data into strategic value, then hardwiring that value into the fabric of your organization’s culture and daily practices, ensuring it remains a wellspring of growth rather than a short-lived novelty.
1.4. Key Pillars of a Data-Driven Organization
Building a truly data-driven enterprise demands a coordinated focus on several interconnected pillars—people, culture, technology, processes, governance, and strategic alignment—that work together to make data both accessible and actionable. Scholars and industry experts agree that failure in any one of these areas can derail even the most promising analytics initiative, while success across all of them can yield a lasting competitive edge. Davenport and Harris (2007) long ago highlighted how organizations that weave these pillars into their core operating model are better equipped to make accurate, timely, and innovative decisions. More recent analyses reinforce that in an era when data volumes are growing at breakneck speed, only companies adept at converting information into strategic insight will remain relevant (OneData AI Insights, 2025).
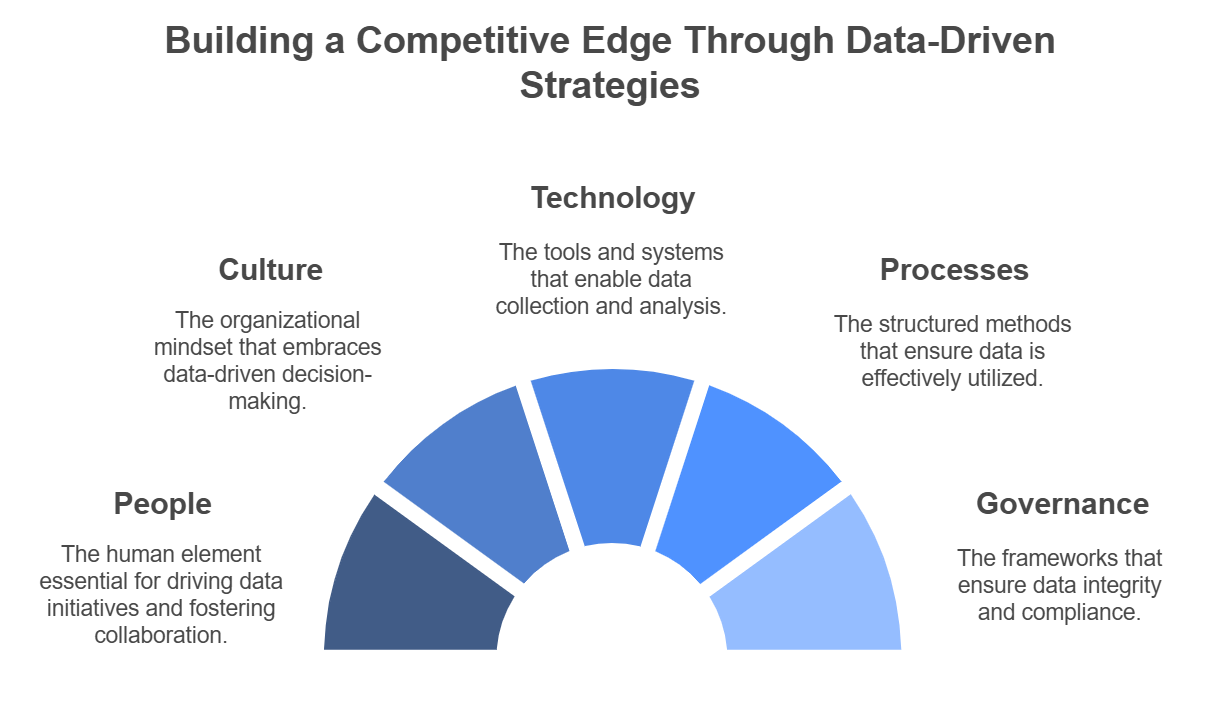
Figure 6: Illustration of fostering a data-centric Culture, leveraging appropriate Technology, establishing clear Processes, empowering People, and ensuring robust Governance. (Image by Napkin).
People occupy a foundational position in this structure. The concept of the “analytics maturity model,” discussed in the research of Davenport (RIB Software Blog, 2024), underscores that organizations move through distinct levels of sophistication—from basic descriptive statistics toward advanced predictive and prescriptive analytics—only when they invest in talent with the right blend of technical and domain expertise. Hiring accomplished data scientists and engineers is a necessary step, but it is hardly sufficient. Those experts must also be supported by business leaders and frontline employees who understand how to interpret, trust, and apply insights in day-to-day decision-making. In many firms, the “data skills gap” is stark: analysts return from workshops brimming with knowledge about machine learning or data visualization techniques, only to confront colleagues who have never seen a Jupyter notebook or who still believe “predictive model” is a fancy term for forecasting tomorrow’s weather. MIT Sloan Management Review (2020) points out that bridging this chasm requires more than throwing a few training sessions on the calendar; it involves sustained mentorship, hands-on collaborations, and executives who demonstrate their own willingness to learn. Successful companies normalize the idea that data fluency is part of everyone’s job description, not just a fancy adornment for the data science department.
Culture forms the connective tissue that determines how enthusiastically people embrace or resist a data-centric approach. This is not about airy mission statements but the daily habits and implicit rules that guide an organization’s behavior. Barton and Court (2013) observe that employees are far more likely to trust analytics when their leaders make decisions grounded in evidence and are transparent about the results—even (or especially) when certain experiments fail. In many corporate environments, “failure” is still treated as a four-letter word, which stifles the very experimentation that data-driven methods thrive on. Publicizing small successes—such as using analytics to reduce product returns or uncover a hidden market niche—can help galvanize broader support. Over time, these quick wins dismantle the myth that data squashes creativity. Instead, it often sparks new ideas by revealing trends that even the most intuitive manager might have overlooked (MIT Sloan Management Review, 2020). A culture that rewards curiosity and iterative learning thus becomes a powerful enabler of advanced analytics.
Technology is the highly visible backbone that keeps data initiatives humming. With the advent of cloud computing, even mid-sized companies can ingest and process staggering volumes of both structured and unstructured data, enabling real-time analytics that were once the stuff of science fiction. OneData AI Insights (2025) underscores how modern data lakes and warehouse architectures streamline the integration of disparate sources, a critical capability for multinational organizations juggling information from multiple product lines and regional markets. Yet technology alone accomplishes little if it is not paired with reliable, repeatable processes. A clear, iterative framework—like CRISP-DM—guides teams through essential steps: scoping out business goals, exploring and preparing data, modeling, evaluating results, and finally deploying insights in real operational settings (Davenport and Harris, 2007). Organizations that skip or gloss over these phases risk ad hoc analytics projects that produce flashy slides but never make it off the corporate intranet. In contrast, a well-defined methodology ensures that each analytical effort is tied to real business problems, with checks and balances at every stage to guard against error or misalignment.
Governance operates behind the scenes as the guardrail that keeps data efforts on track ethically, legally, and strategically. In a world of increasing scrutiny over privacy breaches and data misuse, ignoring governance is a fast ticket to reputational ruin. Regulations such as Europe’s GDPR have raised the stakes, making it clear that cavalier treatment of personal information can incur hefty fines and tarnished brand equity (NewVantage Partners, 2020). Many organizations now rely on data councils, steering committees, or a “Chief Data Officer” role to establish policies around data quality, access rights, and risk management. Atlan Insights (2023) notes that good governance builds trust in the accuracy and security of the data itself. When employees know the information they are using has been vetted and is ethically sourced, they are far more willing to incorporate analytics into their daily workflows. Governance, in essence, is not an obstacle to agility but a foundation for sustainable growth, ensuring that analytics-driven decisions do not stray from the organization’s core values or legal obligations.
Strategic alignment is the glue binding all these pillars into a coherent whole. When leaders explicitly link analytics projects to overarching objectives—like revenue expansion, cost optimization, or market diversification—employees can readily see how their contributions fit into the bigger picture (Barton and Court, 2013). This clarity enhances accountability by clarifying the metrics that matter. Business Case Studies (2024) suggests that enterprises excelling in this area track key performance indicators across various dimensions—financial, operational, customer-centric, and innovation-focused—and update them frequently as the market evolves. In such an environment, data is not an afterthought; it is the compass guiding strategic decisions, large and small. Meanwhile, corporate communication channels reinforce how each analytics project, from a minor improvement in sales forecasting to a major overhaul of the global supply chain, ladder up to the organization’s long-term vision. When employees at all levels grasp the “why” behind these initiatives, they become active participants rather than passive recipients of another executive directive.
Academically, these six pillars are often framed within the broader lens of organizational change theory, which emphasizes that large-scale shifts require a mix of top-down advocacy and bottom-up engagement (Davenport and Harris, 2007). It is not enough for the CEO to proclaim that “data is our new religion” if no one on the factory floor or in the sales trenches understands how to use the analytics tools provided. True transformation appears when technology investment and training programs converge with cultural rituals that celebrate learning and experimentation. For instance, a manufacturing giant might roll out a sophisticated Internet of Things platform to monitor machine performance, but the real magic happens when plant managers see how these real-time metrics can help them slash downtime and energy costs. Over time, those tangible improvements reinforce the notion that data is not just a corporate buzzword but a potent tool for success.
Achieving this integration is never a one-and-done exercise. The business environment evolves rapidly, and data volumes continue to swell. Even organizations that considered themselves advanced five years ago may find they need to refresh their architectures and talent strategies to keep pace with machine learning breakthroughs and shifting regulations (OneData AI Insights, 2025). Yet companies that manage to weave all these pillars—people, culture, technology, processes, governance, and strategic alignment—into a single, well-oiled ecosystem stand to reap enormous benefits. They can respond to market changes with agility, personalize customer engagements at scale, and discover new opportunities for revenue or efficiency that remain invisible to competitors reliant on gut instinct or outdated systems. As MIT Sloan Management Review (2020) asserts, data is no longer a side game for a handful of tech giants; it has become the core currency of modern commerce. The chapters that follow will delve deeper into how executives can embed these pillars within their organizations, covering everything from effective data-collection strategies and robust cleaning routines to the complexities of deploying machine learning models in real-world production environments. It is a demanding undertaking, but for those ready to invest in the future, the payoffs in competitiveness, resilience, and sustainable growth are tough to overstate.
1.5. Implementing Data-Driven Transformation
Data-driven transformation has become a defining hallmark of modern business, reshaping how companies compete, innovate, and deliver value in an increasingly volatile marketplace. Academics reinforce this point by noting that as data volumes grow at dizzying speeds, firms capable of systematically harnessing these torrents gain a disproportionate edge in anticipating consumer trends, optimizing processes, and uncovering new revenue opportunities (Atlan Insights, 2023). From a high-level economic perspective, information asymmetry has always been a source of competitive advantage—think back to how insider knowledge once determined prices at physical trading floors. Today, that asymmetry has shifted online and into massive data repositories, which, if left untapped, might as well be digital landfills. Meanwhile, from an industry standpoint, leaders across finance, retail, healthcare, FMCG, and logistics recognize that clinging to intuition or historical precedents alone isn’t enough to survive in a digital-first environment. Modern organizations must embed analytics into the very fabric of their operations, rethinking everything from daily workflows to overarching strategic goals so that data transitions from an afterthought to a primary driver of direction (NewVantage Partners, 2020).
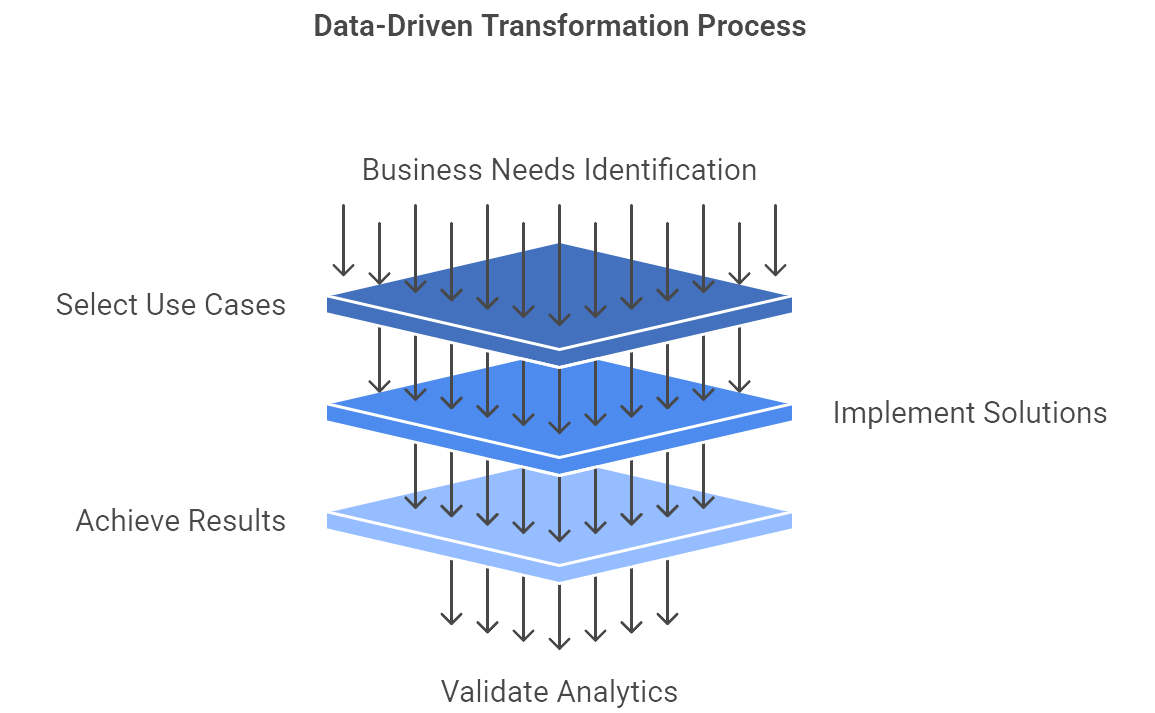
Figure 7: Illustration of the sequential process of leveraging data for business improvement, emphasizing implementation and validation. (Image by Napkin).
The cornerstone of any data-driven overhaul lies in zeroing in on specific, high-impact use cases aligned with genuine business needs. Scholars often categorize this phase under concepts of “strategic fit,” emphasizing that analytics should be targeted where it can deliver measurable performance gains or meaningful risk reductions (Davenport and Harris, 2007). For a financial services giant grappling with fraud, this might mean piloting machine learning algorithms to catch suspicious transactions faster than a legion of human auditors ever could. If successful, the pilot shows off immediate results—lower losses, fewer lawsuits, and a welcome sigh of relief from senior leadership—thereby proving the broader relevance of advanced analytics. Similarly, a retailer wrestling with bloated inventories may decide that real-time demand forecasting is the golden ticket, because better predictions of consumer buying patterns can trim warehouse costs and slash discount-driven losses. These early wins not only validate the hype surrounding analytics but also serve as powerful internal marketing tools, fueling enthusiasm and support for further initiatives.
A practical example comes from a logistics firm that, before going all-in on data science, runs a limited pilot using route-optimization algorithms to reduce delivery times in a single metropolitan area. Operations managers discover that by analyzing real-time traffic patterns and historical driver performance, the company can slash delivery times by 15%. That improvement, although narrowly scoped, demonstrates analytics’ tangible value to both upper management and rank-and-file employees on the ground. When word spreads internally that data science actually helped—rather than just adding new tasks for an overworked IT department—other departments grow eager to see if analytics could solve their pain points too. That snowball effect eventually pushes the entire enterprise toward a deeper adoption of data-driven methods.
The path from a successful pilot to an enterprise-wide adoption, however, is littered with potential pitfalls. Research indicates that simply adding more data sources or loading up on next-gen computing power won’t necessarily result in meaningful organizational impact if there is no cohesive approach (McKinsey Quarterly, 2013). Cross-functional collaboration becomes critical at this juncture. Data scientists are brilliant at building predictive models, but those models can languish in a dusty corner of your cloud platform if operations managers, marketing executives, and IT specialists aren’t looped in from the start. Forming interdisciplinary teams is one practical antidote to this problem. A logistics provider fine-tuning its routing algorithms, for example, can embed analysts alongside fleet managers, customer service leads, and even seasoned truck drivers who can explain real-world constraints that data alone might not reveal. This approach wards off the dreaded “technology push,” where a sophisticated solution ends up solving precisely zero problems on the ground.
Academics studying change management, including those who reference frameworks like Kotter’s eight-step process, emphasize the need for executive sponsorship, clear vision-setting, and an enthusiastic guiding coalition to propel such large-scale transformations. Davenport’s Analytics Maturity Model offers a parallel view, suggesting that as organizations progress from basic, siloed analytics to more complex, predictive, and prescriptive capabilities, senior leaders must actively promote a culture of continuous improvement (RIB Software Blog, 2024). A common tactic here is to establish an analytics Center of Excellence (CoE). This specialized unit sets standards for modeling techniques, shares best practices, and nurtures a sense of community among data professionals. Over time, a well-run CoE helps avoid duplication of effort and fights “reinventing the wheel” syndrome, which can otherwise plague companies trying to scale their analytics efforts across multiple business units (Davenport and Harris, 2007).
Governance—often viewed by skeptics as the parade of compliance officers wagging their fingers—actually plays a pivotal role in successful data-driven transformations. When well executed, governance frameworks help organizations manage data privacy, security, and quality without strangling the creative impulse to experiment (MIT Sloan Management Review, 2020). The tension here is real: push governance too far, and you get bureaucratic quicksand where no analytics project sees the light of day; push it too little, and you risk catastrophic data breaches or errant algorithms that produce nonsense. The sweet spot is a governance model that standardizes data definitions, access protocols, and accountability, so that when someone logs in to run a predictive model, they know precisely what data they’re dealing with, where it comes from, and how they can (and cannot) use it (Atlan Insights, 2023).
An example in practice: a global retailer might formalize a data governance council that includes legal advisors, data scientists, IT leads, and marketing execs who collectively define the organization’s policies for data access and usage. Rather than burying everyone in red tape, the council clarifies which data sets are “trusted” for certain analytics tasks, sets thresholds for data quality, and establishes guidelines for emerging areas like AI-driven personalization. That clarity allows agile experimentation to flourish in a safer environment, knowing that any quick-proof-of-concept effort still stays within the guardrails of privacy and compliance regulations. In essence, well-crafted governance fosters responsible creativity rather than a Wild West environment or, conversely, an oppressive lock on innovation.
No matter how advanced your machine learning models become, a data-driven revolution will stall if the people who are supposed to use these tools remain unconvinced or feel threatened. Numerous studies show that employees often resist analytics initiatives when they fear loss of autonomy or sense that algorithms might replace their “gut instinct” (Business Case Studies, 2024). In some cases, departments view a new analytics project with suspicion, wondering whether it’s just an excuse to cut staffing or centralize decision-making. The result can be silent sabotage, with employees withholding critical domain knowledge or failing to adopt the new system in their daily routines.
An effective strategy is co-creation. Rather than imposing a machine learning model from the top down, organizations can engage frontline workers and middle managers in early pilot phases, seeking their input on what problems need solving and what features would actually be useful. When the model delivers improved outcomes—be it higher sales conversions, fewer quality defects, or faster inventory turnover—those same employees become natural evangelists for data-driven methods (Barton and Court, 2013). Transparent communication also helps. Leaders who explain not only the “what” but the “why” behind analytics initiatives can reduce suspicion and frame data-driven transformation as an opportunity for professional growth. Employees who see that they can learn new skills, advance in their roles, or gain recognition for insightful data-based decisions are far more likely to embrace the new status quo.
From an academic viewpoint, embedding analytics into the DNA of a firm aligns closely with theories of organizational learning, which argue that an entity’s capacity to adapt hinges on its ability to acquire and apply knowledge (OneData AI Insights, 2025). In practical terms, that means companies with analytics in their bloodstream can pivot faster, responding to unexpected market shocks or disruptive technologies with real-time data rather than guesswork. A retailer, for instance, can watch purchasing patterns shift in the wake of a global event—be it an economic downturn or a viral TikTok trend—and recalibrate product assortments on the fly. A healthcare provider can analyze patient data to preemptively allocate resources where demand is likely to spike next. Over time, each data-driven success reinforces the habit of “checking the numbers,” encouraging teams to run new experiments, measure outcomes meticulously, and feed those lessons back into the enterprise’s collective wisdom.
This feedback loop also supports scalability. Once teams prove the viability of a predictive model in one domain, they can adapt and reuse that foundational codebase or approach for parallel problems, such as optimizing marketing campaigns or identifying at-risk supplier relationships. Through repetition and refinement, data-driven processes evolve from a specialized function overseen by a handful of experts to a company-wide method of operation. At that stage, analytics is no longer a novelty or a side project but a fully integrated engine driving the strategic roadmap (MIT Sloan Management Review, 2020).
The journey to a data-driven future is about far more than installing the newest software or recruiting a few PhDs to tinker in a digital lab. While tools and infrastructure are indispensable, the real force behind transformation is leadership’s willingness to sponsor cultural shifts, codify effective governance, and encourage collaborative innovation across every layer of the enterprise. Over time, as analytics projects multiply and mature, the organization’s ability to generate, interpret, and capitalize on data insights becomes its key differentiator, separating agile competitors from those still beholden to outdated best guesses (MIT Sloan Management Review, 2020).
The chapters ahead will delve into the specifics of how to orchestrate these changes, covering everything from the nuts-and-bolts of data collection and cleaning to the advanced intricacies of machine learning deployment in production settings. We will discuss the importance of cross-functional teams and how to handle the messier challenges—like reconciling legacy systems or dealing with reluctant stakeholders who bristle at the idea that an algorithm might do parts of their job more efficiently. Data-driven transformation is not for the faint of heart, and it certainly isn’t an overnight endeavor. Yet for organizations willing to put in the effort, the payoff can be immense: a resilient, innovative culture capable of spotting trends, adapting to volatility, and discovering opportunities that remain invisible to those still relying on guesswork.
1.6. Real-World Examples of Data-Driven Business
Data has rapidly become the linchpin of modern commerce, enabling organizations to optimize their products, processes, and customer experiences with astonishing granularity. Scholars often interpret this shift through resource-based theories, arguing that data functions as a unique, hard-to-imitate asset capable of bestowing sustained competitive advantage on those who wield it effectively. In practical terms, global success stories in entertainment, e-commerce, and retail confirm that when data is methodically integrated into decision-making, companies can unearth new market possibilities while simultaneously fine-tuning their internal operations (Barton and Court, 2013). At the same time, industry experts emphasize that today’s vast—and ever-expanding—digital footprints, from online shopping carts to social media activity, create a relentless flow of information that companies must either harness or risk drowning under. As MIT Sloan Management Review (2020) wryly notes, nimble newcomers often capitalize on this data deluge, forcing established players to adapt or slide into irrelevance.
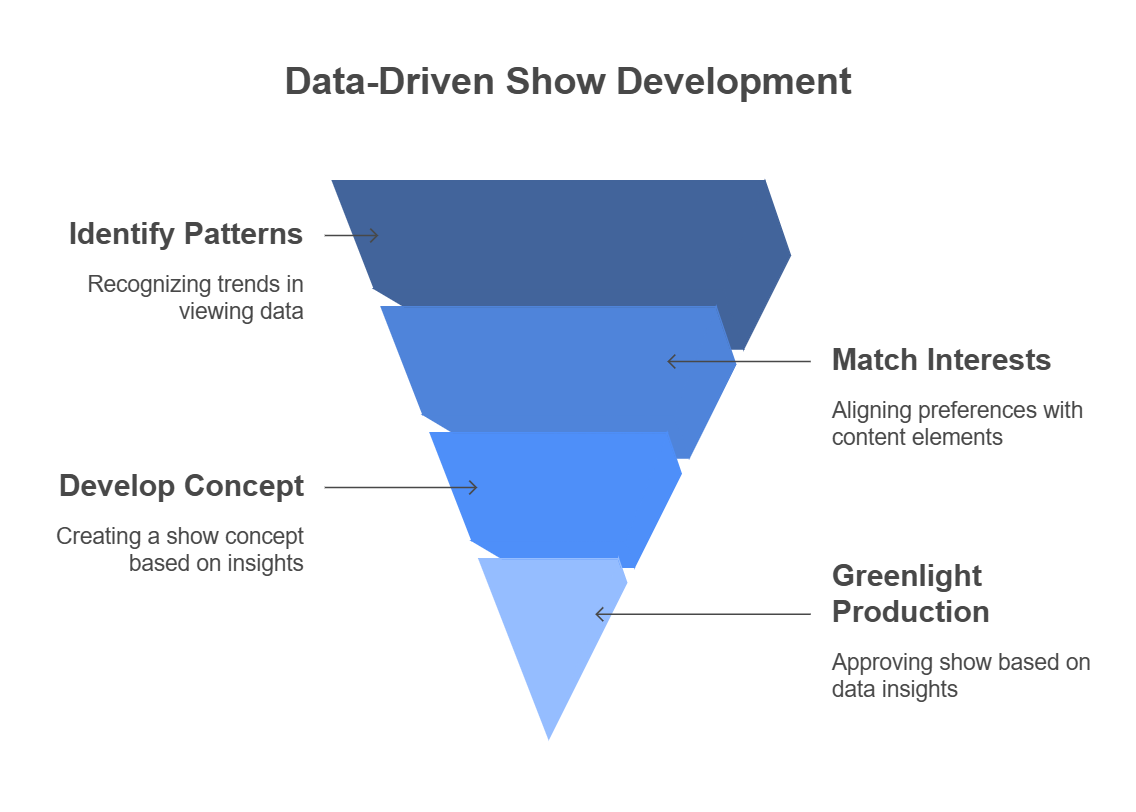
Figure 8: Illustration of how data insights are used to create successful shows, focusing on audience interests and trends. (Image by Napkin).
Netflix exemplifies how data, if diligently leveraged, can upend entrenched industries once reliant on little more than focus groups and hunches. Historically, TV networks rolled out pilot episodes and prayed for the best, guided by a heady mix of gut instinct and Nielsen ratings. In contrast, Netflix decided it might be smarter to crunch the numbers first. Using massive datasets that captured individual viewing histories, search patterns, pause/rewind behaviors, and even the times of day people tend to watch particular genres, Netflix’s data science teams discovered a striking overlap among fans of political dramas, director David Fincher, and actor Kevin Spacey (Business Case Studies, 2024). The result was “House of Cards,” a show greenlit as much by machine learning models as by creative instinct.
This data-first approach doesn’t stop with content production. Netflix’s recommendation algorithms blend watch history, user ratings, session length, and other signals to infer what else you might binge next. The iterative nature of analytics methodologies such as CRISP-DM helps Netflix adjust its algorithms on the fly, testing out new recommendation models to see which yield higher viewer retention. Over time, Netflix has morphed into a global juggernaut, using data not just to produce hits but also to curb subscriber churn, tailor regional content, and even design user interfaces that keep you clicking “Next Episode.” As Atlan Insights (2023) points out, this success story highlights how meticulously curated data, organizational culture, and relentless experimentation can coalesce to topple long-standing industry conventions.
Amazon’s evolution from an online bookstore to a retail and cloud-computing titan is inseparable from its data-driven DNA. The site’s seemingly simple product recommendations—“Customers who bought this also bought…”—are powered by sophisticated collaborative filtering algorithms that process mountains of transactional and behavioral data daily (Davenport and Harris, 2007). Yet Amazon’s data obsession extends far beyond mere personalization. Order processing, inventory management, and delivery route optimization all rely on real-time analytics that parse everything from stock levels to shipping constraints. According to RIB Software Blog (2024), this end-to-end data flow allows Amazon to maintain an almost eerie predictive capability, such as anticipating which distribution center needs more copies of a soon-to-be-popular product or refining routes so precisely that customers often wonder if delivery drivers have supernatural speed.
One reason Amazon can refine these processes so effectively is its cultural embrace of experimentation. Teams deploy small-scale trials, evaluate the results using clear metrics, and either scale up successful experiments or pivot rapidly when the data suggests failure. This approach is reminiscent of the Analytics Maturity Model, where organizations move beyond siloed, descriptive reporting toward a holistic structure that incorporates real-time predictive tools. Analysts often point to Amazon’s prime shipping program as a masterstroke of analytics integration, combining supply chain data, customer behavior insights, and dynamic cost modeling to create a service that simultaneously delights customers and reconfigures their buying habits. The result is an ecosystem that not only sets the bar for online retail but also demonstrates how cross-functional data initiatives can unify technology, operations, and customer experience into a single strategic force (McKinsey Quarterly, 2013).
While Netflix and Amazon operate at the leading edge of Silicon Valley’s digital revolution, Starbucks shows how data can transform even the most tangible, physical business models. Known for positioning its stores as “the third place” between work and home, Starbucks quietly built robust analytics capabilities behind the scenes to personalize experiences and optimize operations (OneData AI Insights, 2025). Every time a customer uses the Starbucks app or loyalty program, they feed a database that captures preferences, buying habits, and even geolocation data (if the user opted in). Armed with these insights, Starbucks fine-tunes product suggestions and promotions so effectively that you might feel the baristas know your caffeine needs better than you do.
Starbucks goes further by employing advanced analytics in site selection. Instead of relying on traditional real estate lore—put a coffee shop near a bustling street, cross your fingers, and hope for a line out the door—Starbucks blends demographic data, competitive analyses, foot traffic patterns, and customer purchase history to predict viable new store locations. This data-savvy approach not only supports expansion strategies but also shapes store layouts and staff scheduling. The result is a near-frictionless customer experience, backed by continuous data monitoring that helps Starbucks adapt quickly to regional tastes and changes in consumer sentiment. As Business Case Studies (2024) notes, this shift from subjective judgment to analytically informed decisions underscores how data can elevate a brand that was already iconic into a more resilient and profitable enterprise.
From an academic viewpoint, these real-world examples align with frameworks like the knowledge-based view of the firm and total quality management, both of which stress the power of real-time feedback loops for sustaining a competitive edge (Davenport and Harris, 2007). Netflix’s willingness to produce content guided by algorithmic findings, Amazon’s relentless focus on refining every operational detail, and Starbucks’s analytics-driven site selection strategies share a common thread: they treat data not as a garnish on top of existing processes but as the main ingredient in strategic, day-to-day decisions. By iterating based on data, these organizations internalize the principle that partial failure or negative findings can reveal priceless information for the next round of improvements.
Another unifying theme is the careful orchestration of both cultural and structural elements to embed analytics across the company. Netflix fosters a culture of experimentation, Amazon places data-driven metrics at the heart of its “customer-obsessed” philosophy, and Starbucks adopts a localized approach to analytics that resonates with its ethos of community and personalization. Each case also illustrates how CRISP-DM or similar frameworks can guide analytics projects from initial problem definition to real-world deployment, ensuring that insights move seamlessly from a data scientist’s sandbox to frontline operations (Atlan Insights, 2023). Scholars argue that this fusion of people, processes, and technology is what sets apart the true data-driven enterprises from those merely dabbling in “analytics theater” without tackling real business challenges (NewVantage Partners, 2020).
Ultimately, these stories confirm that data’s influence is not confined to glamorous tech startups but can permeate any industry that collects information about its customers, products, or operations. Whether your organization aims to forecast sales, reduce inventory waste, or launch groundbreaking offerings, the systematic use of data can reveal patterns that human intuition might miss. As Barton and Court (2013) indicate, companies that treat data as a strategic asset often gain greater insight into emerging consumer demands, forging the kind of agility that can mean the difference between market leadership and a slow, painful fade from relevance. The subsequent chapters will delve into how readers can translate these lessons into action, focusing on the leadership, cultural, and technical frameworks required to elevate data from a resource to a transformative commercial driver.
1.7. Conclusion and Further Learning
The trajectory of modern commerce is increasingly guided by an organization’s ability to interpret and act on data, making analytics prowess a cornerstone of competitiveness. Companies that embrace data-driven transformation stand to reap benefits like cost efficiencies, market agility, and unparalleled customer insight, positioning themselves to scale rapidly and innovate continuously (McKinsey Quarterly, 2013). However, success in this new age demands cohesive efforts that extend beyond deploying the latest analytics platform. Enterprises must develop a culture where decisions are consistently backed by empirical evidence, and where experimentation, measurement, and refinement form the building blocks of every strategic initiative (Barton and Court, 2013).
Crucially, the human element cannot be overlooked. Leaders who invest in data literacy, champion analytics projects, and celebrate data-informed wins play a pivotal role in embedding these competencies across departments (MIT Sloan Management Review, 2020). Meanwhile, robust governance frameworks address the ethical and regulatory considerations inherent in amassing and leveraging large-scale datasets, ensuring that businesses uphold societal expectations of privacy and compliance. Forward-thinking organizations not only implement best practices for data security and quality management but also recognize that transparency and accountability breed trust among customers, employees, and other stakeholders (NewVantage Partners, 2020).
Ultimately, data-driven transformation unfolds as a holistic journey. It begins with an awareness of the strategic importance of analytics, advances through pilots that validate and refine the organization’s approach, and matures into a seamless integration of data insights at every echelon of decision-making. As illustrated by the cases of Netflix, Amazon, and Starbucks, the rewards for those who traverse this path include sustained growth, market resilience, and the capacity to shape consumer expectations in an era defined by unceasing digital disruption. By positioning data as both a strategic compass and an innovation engine, businesses can thrive in a rapidly evolving landscape, turning the promise of analytics into a powerful source of competitive advantage for decades to come (Davenport and Harris, 2007).
Unlocking the full potential of data-driven business transformation often requires continuous exploration and learning. The following prompts are designed to encourage deeper inquiry into advanced topics and practical scenarios related to data-driven strategies. By using these prompts with AI assistants (eq. ChatGPT, DeepSeek, Claude, Gemini), readers can dive beyond the fundamentals covered in this chapter and gain richer, more nuanced insights. Each prompt is crafted to elicit comprehensive explanations, comparisons, or guidance, effectively leveraging AI to simulate expert consulting or detailed analysis. This approach enables readers to further solidify their understanding and explore how data science principles apply in various contexts. Engaging with these prompts will help translate chapter concepts into actionable knowledge, ensuring that the journey of learning and applying data-driven principles continues well beyond this introductory overview.
Strategic Data Roadmaps: “How can an executive develop a data strategy roadmap for a traditional company transitioning to a data-driven model? Outline the key phases, milestones, and considerations (such as aligning with business goals, required data infrastructure, talent, and change management).”
Building Data Culture: “Our organization struggles with adopting a data-driven culture. What specific steps and initiatives can leadership take to cultivate a data-first culture across all levels of the company? Please include examples of incentives, training programs, or communication strategies that have proven effective.”
Data Maturity Assessment: “What are the stages of data maturity in an organization? Provide a framework for assessing a company’s current data maturity level and recommend actions to progress to the next stage. How might the advice differ for a company at a nascent stage versus one that is advanced in data utilization?”
Aligning Data with Business Value: “How can companies ensure their data science projects deliver tangible business value? Discuss best practices for selecting use cases with high ROI, linking analytics KPIs to business KPIs, and avoiding common pitfalls where data projects may not translate into business outcomes.”
Case Study – Failure to Success: “Analyze a case where a company’s initial attempt at data-driven transformation failed or stalled. What were the reasons (e.g. poor data quality, cultural resistance, lack of strategy)? Now, recommend a recovery plan: what should the company do differently to turn their data initiative into a success?”
Data-Driven Decision Making vs. Intuition: “Discuss the balance between data-driven decision-making and human intuition in leadership. Are there scenarios where intuition should override data? How can leaders effectively combine data insights with their experience and judgment, especially in high-stakes decisions or when data is inconclusive?”
Scaling Analytics Teams: “Our business has some successful data science pilots – how do we scale analytics capabilities organization-wide? Advise on building an analytics center of excellence, decentralized vs. centralized team structures, talent development, and governance as the company scales its data initiatives.”
Real-time Analytics: “Explain the challenges and benefits of implementing real-time analytics in a business (for example, streaming data from IoT devices or live customer interactions). What technologies and processes are needed, and what new opportunities can real-time data enable for decision-making and customer experience?”
Data Monetization Models: “Beyond internal improvements, how can a company monetize its data externally? Discuss models of data monetization such as data-as-a-service, analytics products, or strategic data partnerships. Provide examples of companies that generate revenue from their data or analytics insights.”
Ethics and Privacy: “What are the key ethical considerations in data-driven business operations? Provide guidelines on ensuring responsible use of data – covering topics like customer privacy (e.g. compliance with GDPR), algorithmic bias, transparency, and obtaining stakeholder trust in data practices.”
Emerging Technologies Impact: “How will emerging technologies (like artificial intelligence, machine learning, and cloud computing) continue to shape data-driven business transformation in the next 5–10 years? Discuss anticipated advancements (e.g. GPT-based AI, automated machine learning, edge computing) and how businesses can prepare for them.”
Comparing Industries: “Compare how data-driven transformation might differ between two industries – for example, retail vs. healthcare. What unique types of data, regulatory constraints, or strategic objectives does each industry have, and how do these influence the way companies leverage data for competitive advantage?”
Change Management in Data Projects: “What are effective change management tactics specifically for data analytics initiatives? Outline how to manage stakeholder expectations, address fear of change among staff, and ensure adoption of data tools and insights in everyday workflows.”
Data Quality Issues: “Our analytics efforts are hampered by inconsistent data. How can an organization implement a robust data governance and quality management program? Describe the roles (e.g. data owners, stewards), processes for cleaning and validating data, and tools that help maintain high data quality across the enterprise.”
Predictive vs. Prescriptive Analytics: “Illustrate the difference between predictive analytics and prescriptive analytics in a business context. Provide examples of business decisions that each type can inform, and discuss what additional capabilities (e.g. optimization engines, what-if analysis) are needed to move from prediction to prescription.”
ROI of Data Initiatives: “CFOs often ask about the ROI of data projects. How can we effectively measure and communicate the ROI or business impact of data science initiatives? Suggest metrics or case examples (such as cost savings, revenue uplift, productivity gains) and how to attribute changes to data-driven actions.”
Data-Driven Innovation: “In what ways can being data-driven foster innovation in products or services? Discuss how data insights can lead to new product features, personalized services, or even entirely new business models (such as Uber’s platform model or Netflix’s original content strategy).”
Competitive Response: “If a company’s competitor becomes highly data-driven (e.g. using advanced analytics to cut costs or personalize marketing), how should it respond? Outline a strategic plan for a company to rapidly boost its own data capabilities to stay competitive – covering quick technology adoption, hiring, and possibly collaborating with third-party analytics firms.”
Data Security in Transformation: “As businesses become more data-driven, they often collect sensitive data. What are the best practices for data security and cyber risk management in this context? Provide advice on securing data infrastructure, access controls, encryption, and incident response planning to protect data assets.”
Future Organization Structures: “How might organizational structures evolve as companies become fully data-driven? Discuss concepts like the role of the Chief Data Officer (CDO), decentralized decision-making empowered by data, and how day-to-day management might change when data is embedded in every decision.”
By exploring these advanced prompts, readers can deepen their mastery of data-driven business concepts. Each prompt is an invitation to investigate further and view the topic from different angles – strategic, technical, ethical, and operational. We encourage readers to actively use these prompts as a springboard for discussion or as practice to apply critical thinking. The insights gained will reinforce the knowledge from this chapter and inspire confidence in leading data-driven initiatives. Remember, the journey to becoming truly data-driven is one of continuous learning and curiosity, and these prompts are tools to fuel that ongoing growth.
Gaining theoretical knowledge is essential, but hands-on experience is where the real understanding of data-driven transformation solidifies. The following practical assignments are designed for business leaders and professionals to apply the concepts from this chapter in real-world contexts. Each assignment simulates a scenario or a project that one might encounter in a data-driven transformation journey. By working through these exercises, readers will move from insight to action – assessing their own organization, crafting strategies, and implementing data-centric solutions. Detailed guidance is provided for each assignment to help you execute the task, evaluate the outcomes, and refine your approach. These assignments not only reinforce the chapter’s lessons but also build confidence in driving data initiatives. Embrace these challenges as an opportunity to experiment and learn by doing, and remember that iteration is part of the process – each attempt will bring new insights and improvements.
🛠️ Assignments
📝 Assignment 1: Data Maturity Self-Assessment
🎯 Objective:
Evaluate your organization’s current level of data maturity and identify gaps to address.
📋 Task:
Using a data maturity model (e.g. levels ranging from ad-hoc data use to fully integrated, predictive analytics), conduct an audit of how your company uses data today. Document things like: availability and quality of data, tools and infrastructure in place, skills and training of staff, leadership support, and examples of data being used in decision-making. Classify the organization’s maturity level (e.g. “Developing” or “Intermediate” stage).
💡 Guidance:
| Aspect | Details |
|---|---|
| Steps to Complete: | Interview key stakeholders in different departments about their data practices. Review any existing analytics projects or reports. Compare findings to a standard maturity framework (you can use published models from Gartner or Deloitte as reference). |
| Evaluation: | Identify at least three strengths (areas where the company is doing well, such as a strong BI tool or a dedicated data team) and three weaknesses or gaps (such as siloed data or lack of executive training on analytics). |
| Refinement: | Based on the gaps, outline specific actions needed to progress to the next maturity level. For example, if data is siloed, one action might be to implement a centralized data lake or warehouse. If there’s a skills gap, a plan might include hiring data analysts or upskilling current staff. Share the assessment with a peer or mentor for feedback, and refine the action plan to ensure it’s realistic and aligned with business goals. |
📝 Assignment 2: Develop a Data-Driven Initiative Proposal
🎯 Objective:
Propose a new data-driven project that addresses a real business problem in your organization.
📋 Task:
Identify a challenge or opportunity in your business unit that could be tackled with data (for example, high customer churn, inefficient supply chain routing, or low marketing ROI). Formulate a proposal for a data-driven solution – this should include the business question to answer, the data required, the analytics approach (e.g. building a dashboard, creating a predictive model), and the expected outcome/benefit (e.g. “reduce churn by 10% in next 6 months”).
💡 Guidance:
| Aspect | Details |
|---|---|
| Steps to Complete: | Clearly articulate the problem and why it matters in business terms. Outline where relevant data will come from (internal systems, customer surveys, etc.) and ensure data availability. Choose appropriate analytics methods: it could be as simple as descriptive analysis or as advanced as machine learning, depending on the problem and available resources. Consider a small pilot scope first. |
| Evaluation: | Use the proposal to engage stakeholders – present it to a manager or team member for feedback. Evaluate its clarity: does it convincingly link data analysis to solving the business problem? Also check feasibility: are the data and tools accessible? Is the timeline reasonable? |
| Refinement: | Incorporate feedback to strengthen the proposal. You may need to narrow the scope or clarify the expected ROI. Make sure to include how you will measure success (KPIs). The end result should be a one- to two-page document that could realistically be pitched to an executive sponsor, demonstrating both understanding of the data science concept and its practical application for business value. |
📝 Assignment 3: Data Dashboard Creation and Insights
🎯 Objective:
Turn raw data into actionable insights by creating a simple dashboard or report for decision-makers.
📋 Task:
Choose a dataset from your business (for example, sales figures, website analytics, operational metrics) and build a basic dashboard or report that highlights key performance indicators (KPIs) and trends. This can be done using tools like Excel, Tableau, or Power BI (whichever you have access to). Focus on presenting 3-5 important metrics and include at least one visualization (chart or graph) that would help an executive quickly grasp the situation and make a decision. For instance, a dashboard for sales might include monthly sales trend, regional performance comparison, and a top products chart.
💡 Guidance:
| Aspect | Details |
|---|---|
| Steps to Complete: | Acquire the data (ensure it’s clean – fix or note any quality issues). Identify which metrics align with your business’s goals (e.g. customer acquisition cost, inventory turnover rate). Use a tool to create charts such as line trends or bar charts. Arrange them logically (e.g. overall trend at top, breakdowns below). Add brief annotations or headlines interpreting the visuals (e.g. “West region sales growing 5% MoM, leading all regions”). |
| Evaluation: | Share the dashboard with a colleague or supervisor and gather feedback on clarity and usefulness. Did they understand the key message? Was anything confusing or missing context? Also, evaluate whether creating the dashboard revealed any data issues or interesting insights you weren’t aware of before. |
| Refinement: | Based on feedback, refine the visuals (maybe a different chart type communicates better) or the data (perhaps you need to segment further or calculate an additional metric). The goal is to iterate until the dashboard can stand on its own in delivering a clear story. Finally, document what decisions or actions could be taken from this dashboard (e.g. “invest more in West region marketing, as it’s responding well”) to close the loop between data and decision. |
📝 Assignment 4: Pilot a Data-Driven Decision Process
🎯 Objective:
Practice making a real business decision using a data-driven approach, then reflect on the outcome.
📋 Task:
Identify an upcoming small-scale decision in your work that you would normally make based on experience or intuition, and deliberately approach it in a data-driven way. For example, this could be deciding which marketing channel to invest extra budget in next month, choosing a vendor for a service, or optimizing a process. Gather relevant data for this decision (past performance data of marketing channels, vendor performance ratings, process cycle times, etc.), analyze it (even simple analysis like average, trend, or correlation), and use it to guide your decision. Document the decision made and the data rationale behind it. After some time (e.g. a month or appropriate period), review the results of the decision against expectations.
💡 Guidance:
| Aspect | Details |
|---|---|
| Steps to Complete: | Clearly state the decision to be made and what a “good outcome” looks like (KPIs or criteria for success). Collect data before deciding: this could involve pulling a report or even doing a quick survey. For instance, if allocating marketing budget, look at cost per lead and conversion rates by channel from recent campaigns. Use the data to pick the option with the best metrics rather than the one that “feels” right. Record your decision and prediction (e.g. “I predict channel X will yield a better ROI next month based on the data”). |
| Evaluation: | When results are in, analyze whether the data-driven decision achieved the expected outcome. Discuss what went as expected or not. Importantly, evaluate the process – did using data make you more confident or lead to a better discussion with stakeholders? Were there any difficulties (like data was hard to get, or didn’t fully match the context)? |
| Refinement: | Reflect on how you might improve your data-driven decision process next time. Perhaps you realized you needed to factor in an external trend or that some data was misleading. Write a short summary of this experiment: the decision, data used, outcome, and lessons learned. This exercise will help reinforce the habit of seeking out data for decisions and understanding its impact in a controlled, low-risk setting before applying to bigger decisions. |
📝 Assignment 5: Data Strategy Presentation
🎯 Objective:
Synthesize chapter insights into a strategic presentation that could persuade an executive team to invest in data-driven initiatives.
📋 Task:
Assume you are asked to brief your company’s leadership on why and how to pursue data-driven business transformation (essentially condensing this chapter’s lessons into actionable advice). Prepare a concise presentation (5-7 slides, or a written memo if slides aren’t feasible) covering: (a) Why becoming data-driven is critical for your company (include 1-2 industry stats or case examples relevant to your context), (b) Current state assessment (you can leverage findings from Assignment 1’s self-assessment), (c) Proposed initiatives or roadmap (specific projects or investments needed, such as implementing a data warehouse, hiring data analysts, piloting customer analytics, etc.), and (d) Expected benefits and how you will measure success.
💡 Guidance:
| Aspect | Details |
|---|---|
| Steps to Complete: | Outline your narrative first – for example, “In today’s market, companies that use data outperform others (insert stat); our company is behind in areas X and Y; I propose we start with these initiatives; if we do, we expect outcomes Z.” Keep the message executive-level (focus on benefits, costs, and strategic fit, not technical jargon). Use visuals or charts where possible – perhaps re-use the dashboard from Assignment 3 to illustrate how data can provide insights, or a simple graph showing industry trends. |
| Evaluation: | Practice delivering this presentation or have a colleague review the memo. Are the points convincing? Check if you’ve answered the implicit questions leaders might have: “How much will this cost? How long will it take? What are the risks? Who will lead it?” Make sure the ask and next steps are clear. |
| Refinement: | Incorporate feedback to tighten the argument. You might add a comparison with a competitor or industry benchmark to highlight urgency, or simplify the roadmap to a more digestible plan. Ensure that your references to data or case studies are credible (cite sources briefly if appropriate). The final deliverable should be something you’d feel confident presenting in a boardroom – concise, evidence-backed, and compelling. By completing this assignment, you translate the chapter’s content into a concrete call to action tailored for your organization, which is a pivotal skill for any data-driven leader. |
By undertaking these assignments, readers actively bridge theory and practice – assessing their environment, making decisions with data, and advocating for change. Each assignment is an opportunity to learn by doing: you will uncover practical challenges (like data availability or resistance to change) and learn how to address them. Remember to treat these exercises as iterative learning experiences; even if outcomes aren’t perfect on the first try, the insights gained are invaluable. In the new age of data-driven business, the ability to apply knowledge in real situations is what truly sets leaders apart. Good luck, and enjoy the process of turning data-driven concepts into action!
Comments