Chapter 11
Evaluating and Interpreting Model Performance
"AI model evaluation is not just a technical exercise; it’s a strategic process. By understanding the broader context of the model’s outputs, we can ensure our AI systems create meaningful value while aligning with business goals and ethical standards." — Anna Samuelsson
Executives who understand how to measure, validate, and interpret model performance are better positioned to transform data-driven initiatives into powerful competitive advantages. This chapter began with foundational explanations of why model evaluation is crucial and progressed to discussing key performance metrics that directly impact commercial objectives. It then explored the importance of business-focused model interpretation, highlighting both interpretability tools and real-world examples. Building on these insights, the discussion moved to methods for validating models in real-world settings and monitoring them over time to avert pitfalls like model drift. The chapter closed with strategic takeaways for business leaders, reminding them that continuous, well-designed evaluation processes are the bedrock of successful data science initiatives.
11.1. Introduction to Model Evaluation
Model evaluation is often hailed as the finishing line of a data science project, when in truth, it is just the beginning of another cycle of reflection and refinement. In the broader context of data science, executives and technical teams spend countless hours collecting, cleaning, and exploring data, only to realize that all of this effort culminates in one simple question: “Does this model actually deliver business value?” In commercial settings, data science does not exist in a vacuum. It is intertwined with strategic goals, cross-functional collaboration, organizational culture, and the bottom line. A powerful predictive model that is disconnected from real business needs is about as useful as a sports car parked in a garage with no fuel. Model evaluation, therefore, has the monumental task of ensuring that the car not only runs but also gets the organization exactly where it needs to go.
At the most basic level, model evaluation measures how well a predictive model performs on data it has not encountered during training (Provost and Fawcett, 2013). This assessment goes beyond routine technical metrics—like accuracy, precision, or mean squared error—and extends to whether the model can produce the commercial impact promised at the project’s inception (Davenport, 2018). In some organizations, “success” might be higher revenue or more efficient operations; in others, it might be minimized risk or enhanced customer satisfaction. Without a clear and honest definition of success, a data science team may end up celebrating a so-called “perfect” model that is, in reality, immaterial to the bottom line.
For example, consider a major retail chain eager to deploy a model that predicts which customers are most likely to respond to a promotional campaign. If the model is evaluated purely on a high overall accuracy, the team might neglect the critical metric of how many new sales conversions were actually generated. It might turn out that the model “played it safe” by suggesting that a small fraction of customers would respond, leading to fewer marketing costs but also losing out on significant upselling opportunities. In this scenario, the model is technically sound—it might even clock in at 95% accuracy—but largely useless for the retailer’s strategic objective of boosting sales.
Model evaluation underpins decision-making by quantifying uncertainties and providing evidence of a model’s reliability in meeting corporate goals (Kuhn and Johnson, 2013). It helps expose risks, such as data bias, that could sabotage a project’s return on investment or damage a brand’s reputation (McKinsey, 2020). A model that appears pristine in a controlled environment may reveal embarrassing blind spots in the real world, where data can be incomplete, messy, or subject to abrupt changes in consumer behavior. Executives need to interpret these findings in light of broader strategic concerns, ensuring that any predictive solution aligns with the organization’s objectives, ethical standards, and compliance requirements.
In many ways, model evaluation acts like a brutal (yet necessary) reality check. It forces data scientists, domain experts, IT teams, and business leaders to confront the truth that technical brilliance means very little if it cannot be translated into tangible commercial gains. This is no time for sugar-coating. If the model’s predictions are off-target or ethically questionable, it is better to acknowledge it early and rectify the problem than to push an underperforming solution into production and hope for the best. Indeed, ignoring a failing model is a surefire way to watch profits vanish and stakeholder trust evaporate.
In commercial environments, model evaluation thrives as an iterative, collaborative process that should begin well before the final model is in sight (Gartner, 2021). The much-celebrated CRISP-DM (Cross-Industry Standard Process for Data Mining) framework highlights the need to involve end-users—and, by extension, executives—early in defining success criteria (Software Engineering Stack Exchange). This is not mere bureaucratic box-checking. On the contrary, it ensures the model’s performance metrics genuinely reflect business priorities rather than technical vanity. A high AUC (Area Under the ROC Curve) or R-squared value might impress the data science community, but it may mean nothing if the model fails to move the dial on key performance indicators that matter to the executive suite.
A practical way to ensure alignment is to bring multiple stakeholders into the evaluation phase. Data scientists understand the intricacies of the model, while domain experts know the nuances of the business environment. Executives set the strategic direction and hold the purse strings. When these perspectives converge, the organization can settle on an evaluation framework that balances technical rigor with the reality of market demands. This may involve re-splitting data to include more recent customer behaviors, running a series of pilot tests in limited production settings, or building new dashboards that show how predicted outcomes track against actual revenues in near real-time.
A common pitfall in data science initiatives is reporting only technical metrics—such as accuracy, error rates, or F1 scores—that do not shed light on actual business value (What Leaders Should Know About Measuring AI Project Value). If a bank’s fraud detection model spots anomalies with 99% accuracy but only prevents a tiny fraction of fraudulent transactions because it was set up to minimize “false alarms,” the bank may end up saving little money and inconveniencing legitimate customers. The real success metric would be the reduction in total fraud losses, not the model’s accuracy in a vacuum.
This disconnect between technical performance and commercial impact is why a robust evaluation strategy is so crucial (Algorithma). Instead of reporting a single number, executives should demand (politely or otherwise) a set of metrics that map directly to financial or operational KPIs. For instance, a churn prediction model for a telecommunications company might be evaluated on how much it reduces customer attrition, not just how many churners it correctly identifies. By focusing on the actual cost savings of retention or the revenue from cross-selling to at-risk customers, the leadership team can quickly see whether the model is earning its keep or merely inflating the data science department’s ego.
One frequent misstep is over-reliance on historical data. Models calibrated solely on past events risk becoming irrelevant when market conditions shift—be it due to a global pandemic, sudden regulatory changes, or even viral social media trends. Another pitfall is ignoring the fact that model performance in a sandbox environment may degrade quickly in the wild. This phenomenon, often referred to as data drift, occurs when the characteristics of incoming data differ substantially from the training set. Executives who do not plan for ongoing retraining or monitoring can find their “state-of-the-art” model about as valuable as last year’s marketing slogans.
There is also the danger of focusing too narrowly on a single success criterion. For instance, an insurance company might fixate on lowering claim payouts by aggressively flagging potential fraud—only to discover it has alienated its loyal customer base by denying valid claims. No amount of technical wizardry will fix the public relations fiasco that ensues. A comprehensive evaluation approach ensures that multiple dimensions of performance—financial, customer-centric, ethical—are adequately balanced.
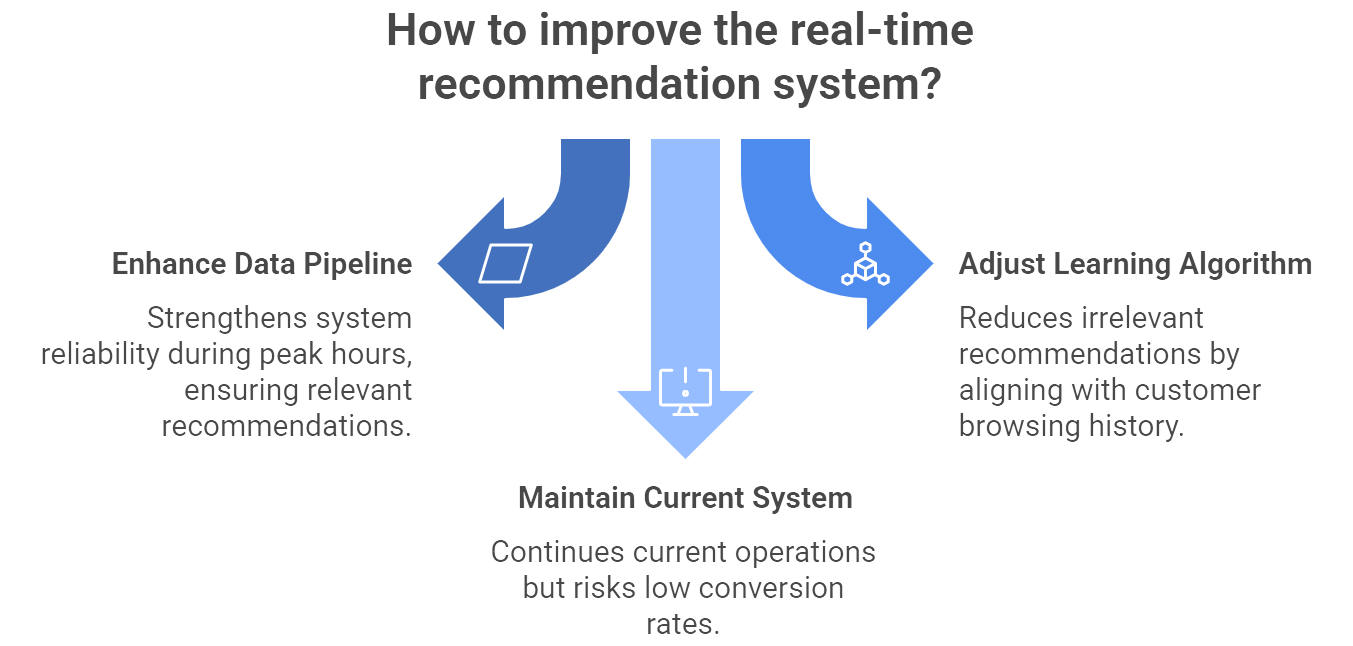
Figure 1: Illustration of a strategic choice for optimizing real-time recommendations, weighing the benefits of data pipeline upgrades and algorithm tweaks against the stagnation of maintaining the current system. (Image by Napkin).
Imagine a global e-commerce platform that rolled out real-time product recommendations. The data science team diligently tested its recommendation engine offline, achieving a stellar precision rate. However, once deployed, it turned out that the real-time data pipeline was overwhelmed during peak shopping hours. The system began pushing random items that had higher profit margins but little relevance to customer browsing history, presumably because it was “learning” from incomplete data. Despite high offline performance metrics, the live system tanked conversion rates.
To recover, the company had to perform an in-depth evaluation of not only the model’s predictive prowess but also the end-to-end infrastructure. The lesson was brutal: a model might be top-notch in the lab yet fail under real-time conditions if the supporting architecture is inadequate. After recalibrating the engine and optimizing the data pipeline, the organization implemented a new evaluation framework that measured performance based on real-time conversion lifts, average order value, and system stability—factors that directly affected revenue. Once these metrics improved in a live setting, the model’s commercial value finally became undeniable.
A model that passes evaluation does not rest on its laurels forever. Deployment and maintenance are the next frontier, where models must be continually monitored, retrained, or even replaced as market dynamics evolve. This is especially critical in environments susceptible to concept drift (where the fundamental relationships in data change) and in industries with tight regulatory controls. Leaders need to champion a culture in which model evaluation is not a one-time milestone but a continuous process integrated into the organization’s broader commercial strategy (Jordan and Mitchell, 2015).
Moreover, with the rise of AI ethics concerns and real-time analytics, it is imperative for executives to scrutinize not only technical metrics but also societal impacts, data privacy, and fairness. A perfectly accurate model that discriminates against certain demographic groups is a lawsuit waiting to happen, and no board of directors wants that on their annual report. By building a robust governance framework around model evaluation, organizations can better navigate the complexities of modern data science deployments.
Ultimately, the success of model evaluation—and of data science at large—depends on an organization’s leadership and culture. Executives must provide clear goals, sufficient resources, and unwavering support for iterative experimentation. Data scientists should be empowered to speak candidly about shortcomings, whether they lie in the dataset, the model, or the broader business processes. Domain experts should be consulted early and often, ensuring the nuances of commercial strategies are baked into every model’s objectives. When these elements align, model evaluation stops being a dry exercise in statistics and becomes a strategic tool for navigating competitive markets and driving innovation.
Model evaluation stands at the intersection of technical proficiency and commercial pragmatism. It is the litmus test that reveals whether your data science investments are poised to enhance revenue, reduce costs, and deliver sustainable competitive advantage—or simply produce impressive reports with little impact. By involving the right stakeholders, adopting robust evaluation metrics tied to business KPIs, and embracing a continuous improvement mindset, organizations can transform model evaluation from a mundane technical chore into a strategic enabler for growth. The executive who glances at the latest model performance dashboard should do so with confidence, knowing that every percent of accuracy, every confusion matrix, and every recalibration ultimately contributes to meaningful business outcomes. If you dare skip or skimp on this stage, be prepared to wave your data science budget—and your commercial edge—goodbye.
11.2. Key Performance Metrics
Defining what “performance” means for a predictive model is a deceptively complicated affair. On paper, you might assume that all executives need is a single number that tells them if the model is “good.” In reality, performance metrics are far more diverse and nuanced, largely because no one-size-fits-all measure can capture the different trade-offs, risks, and business objectives at play (Provost and Fawcett, 2013). The conversation around model metrics has grown even more critical in today’s environment, where data-driven decisions impact everything from personalized marketing to real-time fraud detection and AI-driven product recommendations. A model that looks marvelous in a tidy, balanced dataset may crumble under the pressures of skewed distributions, high-stakes false positives, or rapidly shifting market conditions. Executives need to know which metrics matter for their specific goals—and they need a brutally honest assessment when a promising metric on paper is functionally worthless for commercial success.
Most newcomers to data science latch onto accuracy first, and understandably so—it is the percentage of predictions that are correct. If a classification model identifies fraudulent transactions 90% of the time, that must be good, right? The problem is that data rarely behave so conveniently. In many commercial contexts—like fraud detection, medical diagnosis, or defect detection—one class is extremely rare. Accuracy can become dangerously misleading if only a small fraction of instances belong to the “positive” or rare class (Algorithma). A model that calls every transaction legitimate might boast a 99% accuracy rate in a highly imbalanced fraud scenario. Is it actually valuable? Hardly. It fails to catch the very cases the organization cares about most, effectively letting thieves waltz off with the money.
Nevertheless, accuracy still has its moments. When classes are roughly balanced, and when each type of misclassification carries a similar cost, accuracy provides a quick, broad overview. It can be especially handy in early exploratory phases or for high-level executive briefings where you need a simple baseline. Yet any executive who stops after glancing at “Accuracy = 95%” should be reminded—in your friendliest, most sarcastic tone—that there are scenarios where 95% accuracy is about as comforting as a parachute with a giant hole in it.
Precision asks a more selective question: “When the model says something is positive, how often is it right?” Formally, precision is the ratio of true positives to all predicted positives. High precision is paramount when false positives are costly, annoying, or reputation-ruining. Think about a high-end retailer that uses an AI-driven fraud detection system at checkout. Declining the payment of a legitimate VIP customer can do significant damage to customer loyalty. If the model is too trigger-happy in labeling transactions as fraudulent, the retailer might win the battle against fraud but lose the war for customer satisfaction (Precision & Recall: When Conventional Fraud Metrics Fall). High precision ensures that when the model does cry “fraud,” there is a good chance it is truly fraudulent. This builds trust among stakeholders who are on the hook for operational decisions, like approving or denying a transaction.
Of course, obsessing over precision alone means the organization might ignore or dismiss many real frauds if the system is tuned to be overly cautious. If missing a fraudster is equally harmful or more harmful, precision-centric strategies can become self-defeating. As always, it depends on what matters most to the business.
Where precision tries to minimize false alarms, recall focuses on minimizing missed cases. Recall measures the fraction of actual positives that the model correctly identifies. In high-risk scenarios, such as healthcare diagnostics or cybersecurity, missing a single positive case can be catastrophic (Bishop, 2006). If your security system fails to flag a critical intrusion attempt, you could face millions in data breaches and reputational harm. In these scenarios, maximizing recall often takes center stage, even at the expense of more false positives.
An overly recall-driven approach, however, can lead to “alert fatigue,” where so many incidents are flagged that human analysts cannot sort through them effectively. A credit card company that sets an extremely low threshold for fraud detection might block or flag a large chunk of legitimate purchases, driving frustrated customers to seek other banks. Hence, while recall is crucial for capturing elusive or rare events, it has to be balanced with the real-world cost of constantly crying wolf.
The F1-score is often celebrated as a middle ground, combining precision and recall into a single metric. It is the harmonic mean of the two, rewarding models that manage a reasonable balance. This can be helpful if you want to benchmark multiple models quickly without diving into separate precision and recall figures. For instance, an F1-score can tell you, in a single number, which model is more effectively capturing positives without drowning you in false alarms.
The catch is that F1 treats precision and recall as equally important. If your business stakes are lopsided—say, a false negative in medical diagnosis is 10 times worse than a false positive—then a single F1 metric might obscure crucial details. Savvy executives and data scientists tend to look under the hood, examining precision and recall directly rather than simply trusting any one composite score (Kuhn and Johnson, 2013).
Another popular metric is the Area Under the Receiver Operating Characteristic Curve, often shortened to AUC-ROC. Without delving too deeply into statistical intricacies, AUC-ROC gives you a sense of how well the model can distinguish between positive and negative classes across all possible probability thresholds. A perfect model will have an AUC of 1.0, whereas random guessing hovers at 0.5.
Executives often like AUC-ROC because it can be neatly summarized in one figure (for instance, “our fraud model’s AUC is 0.90”). It is also relatively robust against imbalanced datasets, though that robustness is not absolute. In extreme imbalance cases, the ROC curve might paint an overly optimistic picture, and a Precision-Recall (PR) curve might be more informative (The Precision-Recall Plot Is More Informative than the ROC Plot When Evaluating Binary Classifiers on Imbalanced Datasets | PLOS One). If your business use case involves detecting something extremely rare, you will want to see PR curves or even a metric like AUC-PR, which better reflects the model’s performance on the minority class.
The above metrics mostly address classification problems, but many business challenges involve predicting continuous values (for example, sales forecasting, demand planning, or revenue projections). In these regression tasks, common metrics include Mean Squared Error (MSE), Root Mean Squared Error (RMSE), Mean Absolute Error (MAE), and R-squared (Bishop, 2006). Each tells a slightly different story about how large your typical prediction errors are and how they are distributed. MSE and RMSE emphasize larger errors more heavily, which can be either good or bad depending on whether your business is more averse to big mistakes. R-squared indicates how much variance in the target variable is explained by the model, but it can be deceptive if you have outliers or a small dataset.
Some organizations go a step further and define custom metrics that incorporate tangible cost-benefit considerations. A bank might create a “profit per decision” metric, penalizing false positives (approving risky loans) and false negatives (denying good borrowers) in monetary terms. This transforms model evaluation into a direct reflection of commercial gain or loss, which is far more meaningful to a CFO than an abstract figure like F1.
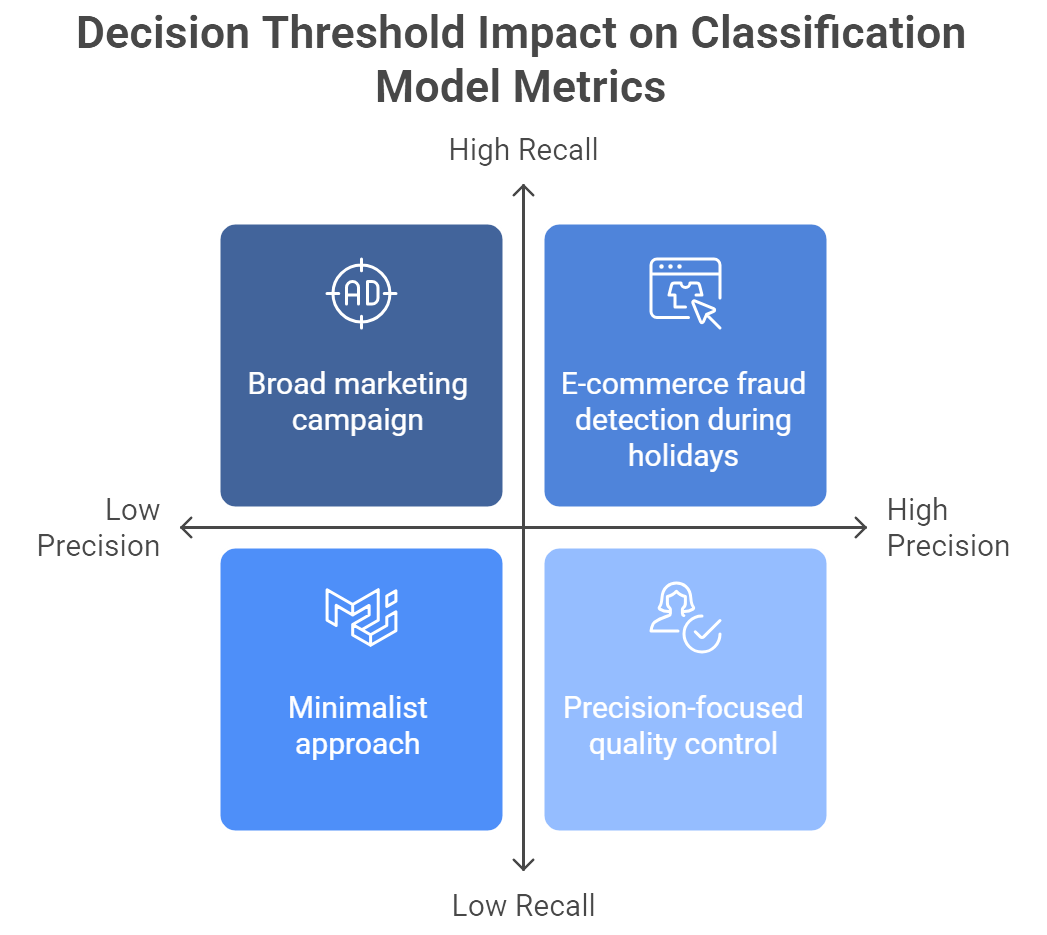
Figure 2: Illustration of the complexities of classification models, illustrating how tweaking decision thresholds can prioritize either precision or recall, as exemplified by e-commerce fraud detection and precision-focused quality control. (Image by Napkin).
A crucial realization is that most classification models produce a probability, not a strict yes/no prediction. Where you set the decision threshold can drastically shift your precision, recall, or other chosen metrics. Higher thresholds yield fewer positives, boosting precision but lowering recall; lower thresholds do the opposite (Algorithma). The “correct” threshold depends on the relative costs and benefits of different errors—something only business leaders and domain experts can fully articulate. In e-commerce fraud, you might temporarily dial up recall during peak holiday shopping to minimize missed fraud attempts, accepting that you may flag more legitimate customers than usual. The point is that this balancing act is not a technical afterthought but a strategic decision that can change day by day, campaign by campaign.
For executives and non-technical decision-makers, wading through a sea of metrics can be daunting. While data scientists might dream about “harmonic means” and “logarithmic losses,” the board simply wants to know if the model is saving money, generating revenue, or reducing risk. The solution lies in forging a translation layer between the technical and commercial perspectives. Confusion matrices can be especially helpful, showing raw counts of true/false positives and negatives. Visual aids like ROC or PR curves can illustrate the trade-offs at different thresholds. And cost-based metrics or direct ROI figures, while more time-consuming to implement, often do the best job of aligning daily data science decisions with the ultimate goal: profit, growth, and competitive advantage.
Consider a marketing team deciding which customers to target for an expensive promotional offer. A simplistic approach might rely solely on recall, trying to reach all potential responders. However, the cost of wasted offers on uninterested customers can quickly erode the campaign’s profitability, especially if each offer is associated with substantial marketing spend. Precision becomes equally important in identifying which segment is genuinely likely to respond. The team could track the F1-score for a quick sense of a model’s balance but might then drill down into profit-based metrics that assign a monetary value to correct predictions (responders) versus incorrect ones (non-responders). Ultimately, the threshold for deciding who gets the campaign would be tuned to maximize net profit rather than raw recall or precision. This approach not only satisfies the CFO’s thirst for ROI but also ensures data science efforts produce tangible commercial outcomes.
Defining and using the “right” metrics is not merely a technical endeavor but a collaborative one. Successful data science teams work closely with domain experts, marketing strategists, operations managers, and finance executives to pinpoint which metrics reflect genuine business value (Kuhn and Johnson, 2013). If a particular department cares deeply about avoiding false positives, it must be represented in the threshold-setting conversations. If the organization is more concerned about missing rare but costly events, that perspective needs to shape the choice of metrics. Without this alignment, one group may optimize for a technical metric that subtly undercuts another group’s objectives, breeding distrust and missed opportunities.
In more advanced scenarios, such as deep learning for real-time analytics or AI-driven processes, the need for robust metrics and collaborative conversations only intensifies. A streaming fraud detection system might need to maintain high recall under strict latency constraints. A deep learning recommender engine might focus on ranking metrics (like mean average precision) to ensure personalized suggestions remain relevant as user behavior shifts by the hour. Despite the fancier technology, the core question remains the same: which metrics convincingly demonstrate that the model drives commercial value rather than just academic novelty?
In the grand tapestry of data science, performance metrics are the thread that weaves technical outputs into business realities. Accuracy, precision, recall, F1-scores, and AUC-ROC each highlight different strengths and weaknesses of a model, but none is universally best. The key is to select, customize, and tune metrics that directly reflect the organization’s strategic goals, be it maximizing revenue, minimizing risk, or maintaining regulatory compliance. This requires candid dialogue between data scientists and executives, a willingness to explore trade-offs, and the humility to recognize that a dazzling metric in isolation might be commercially meaningless. By adopting a holistic, context-driven approach to performance metrics, businesses ensure their data science initiatives are not just “technically sound” but also yield real commercial impact.
11.3. Business-Focused Model Interpretation
Model interpretation has become a hallmark of responsible data science, especially in high-stakes commercial settings where opaque models can undermine trust, spark regulatory headaches, or even cause harm. While some executives might be tempted to ask why it matters how a model arrives at its predictions, those same leaders typically become far more curious when an auditor, a regulator, or a disgruntled customer demands an explanation. In today’s data-driven world, a well-performing model is only as valuable as its ability to earn stakeholder confidence—and that confidence often hinges on interpretability and explainability (Molnar, 2019).
Interpretability describes the transparency of a model’s inner workings. This might be a simple decision tree or a logistic regression where you can directly inspect coefficients or rules. It is akin to looking under the hood of a car and seeing exactly how the engine is laid out. Explainability, on the other hand, focuses on why a specific prediction was made, even if the engine under the hood is a sophisticated black box (Splunk). A model might be inherently uninterpretable—like a deep neural network that churns through mountains of data—but can still be rendered explainable through techniques that break down the model’s logic for individual predictions.
In practical terms, interpretability addresses how the entire model functions (for instance, “lower income and higher debt signal greater default risk”), while explainability zeroes in on a single output (“loan application denied because the model identified income below $30k, a high debt-to-income ratio, and a short credit history as red flags”) (Goodfellow, Bengio and Courville, 2016). Savvy executives often demand both: an overall understanding of how the algorithm behaves, plus the ability to offer concrete, human-readable explanations for each decision.
In regulated industries such as finance and healthcare, explainability is more than a mere nicety; it is a legal and ethical requirement (The Business Case for Machine Learning Interpretability). Banks in many jurisdictions must provide reasons for loan rejections to comply with fair lending laws. Hospitals need to ensure that life-or-death decisions—like triaging pneumonia patients—are not driven by ill-informed correlations (The Business Case for Machine Learning Interpretability). Even outside these fields, interpretable models build broader trust, both internally (among C-suite executives and operations teams) and externally (for customers, investors, and regulators).
Lack of interpretability can lead to catastrophic outcomes. A now-famous cautionary tale involves a pneumonia risk prediction model that incorrectly gave patients with asthma a lower risk score because they tended to receive immediate, more aggressive care and thus had better recorded outcomes. This flawed logic—only discovered by inspecting how the model weighed different features—could have endangered lives had the model been deployed blindly (The Business Case for Machine Learning Interpretability). For corporate leaders, such stories illustrate the lethal combination of a well-intentioned but opaque model paired with real-world consequences.
Leaders must also consider that interpretability can unearth hidden biases. A financial institution might discover that its shiny new lending algorithm heavily weighs a feature correlated with race or gender, raising alarms about potential discrimination (Two Sigma). By adopting explainable AI (XAI) practices, organizations can catch and correct such pitfalls before they become lawsuits or PR nightmares. This clarity not only enhances ethical compliance but also fosters a culture of accountability and alignment with corporate values.
Enter a new generation of interpretability tools designed to shine a light on even the darkest AI black boxes. While data scientists love acronyms and fancy names, executives should know the concepts are fairly straightforward at their core.
Some models, especially tree-based ensembles like random forests or gradient boosting machines, inherently produce a global ranking of which features most influence predictions. If you are predicting customer churn, the model might tell you that time since last login, number of support tickets, and account age are top drivers. Though this reveals little about individual decisions, it is a useful broad-strokes view of what the model deems important (Witten, Frank, Hall and Pal, 2016).
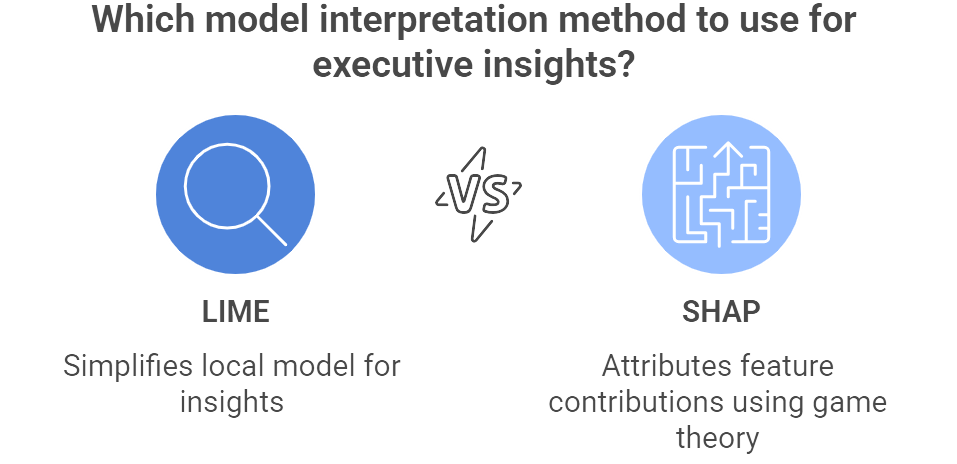
Figure 3: Illustration of a strategic choice between LIME's local model simplification and SHAP's game-theory based feature attribution for deriving executive-level insights from machine learning models. (Image by Napkin).
Partial dependence plots reveal how altering a single feature influences the model’s output on average. For a churn model, you might see that raising “account tenure” from 0 to 12 months reduces churn risk steadily, leveling off thereafter—a handy insight for those trying to improve customer retention. What-if tools allow users to manually tweak input variables (like credit score or annual income) and observe how the prediction changes. This hands-on approach helps executives see the model’s thought process and develop trust in the system’s logic.
Not every model must be a black box. Techniques like generalized additive models can often approach the performance of complex machine learning models while remaining inherently interpretable (Caruana and others). Microsoft’s InterpretML toolkit includes such “glass box” models, appealing to companies that require rigorous transparency from the get-go. However, be warned: not every business problem can achieve top performance with a glass box approach. The commercial question boils down to how much accuracy you are willing to trade for immediate interpretability, or how much effort your team will expend to apply post-hoc explanations on a more complex model (Witten, Frank, Hall and Pal, 2016).
A major hospital planned to deploy a machine learning solution for pneumonia triage, trusting that high accuracy on historical data equaled real-world success. During final checks, doctors noticed the model weirdly favored patients with asthma, labeling them “lower risk.” Digging into the logistic regression coefficients revealed that these patients, already flagged as high-risk by human doctors, were whisked to critical care and thus tended to have fewer adverse outcomes. The model’s interpretation confused correlation for causation. Because the model was interpretable, the team spotted this flaw before it harmed patients (The Business Case for Machine Learning Interpretability).
A financial institution discovered that ZIP code strongly influenced its default predictions, which inadvertently penalized applicants from certain neighborhoods. By employing SHAP explanations, the bank’s compliance team confirmed that location was essentially acting as a stand-in for demographic factors—a legal and reputational landmine. The model was adjusted to reduce (or remove) dependence on ZIP code, ensuring fairer lending decisions (Two Sigma).
An e-commerce platform launched an AI that customized each user’s webpage layout in real time. While initial engagement looked promising, merchandisers balked at the inability to understand why certain products were pushed forward. By exposing partial dependence plots and offering local explanations on product recommendations, the AI team demonstrated the logic behind personalization. Armed with that transparency, the merchandisers and marketing leads were far more inclined to trust—and even champion—the new system.
C-suite endorsement plays a pivotal role in promoting interpretable models. If executives treat transparency as a second-rate concern, data science teams will often default to chasing marginal performance gains with black box approaches. On the other hand, when leadership demands not just what the model predicts but also why, data scientists are encouraged to incorporate interpretability from the design phase onward (Goodfellow, Bengio and Courville, 2016).
Organizations that build robust governance frameworks around AI deployment generally fare better, requiring sign-offs on ethics, compliance, and interpretability before a model sees production. By bringing legal, compliance, data science, IT, and domain experts to the table, companies can ensure that interpretability is woven into the project’s success metrics. This collaboration might involve defining custom “reason codes” for high-stakes decisions or implementing real-time auditing for sensitive automated processes. The result is a business environment where leaders can articulate why an AI system made a certain judgment, and confidently stand by that logic in front of stakeholders and regulators.
Business-focused model interpretation is not an afterthought. It is a strategic imperative that protects brand reputation, secures regulatory compliance, and cultivates trust both within and outside the organization. Executives must recognize that “predictive power” alone is insufficient if the model cannot be explained or corrected when it inevitably makes mistakes. Tools like LIME, SHAP, and partial dependence plots serve as powerful allies for demystifying complex AI, and interpretable or “glass box” models offer a more direct path to transparency for certain problems. Whichever route your organization chooses, a commitment to interpretability pays off in fewer operational nightmares, more engaged stakeholders, and a data science function that genuinely drives commercial value instead of fueling black box anxiety.
11.4. Validating Model Performance in Business Contexts
After a model has been painstakingly designed, built, and theoretically benchmarked, it still must face the ultimate test: does it make sense—and profit—in the messy realm of real business operations? In data science, this transition from lab to the real world is often where even “highly accurate” models flop. Commercially savvy executives know that without robust validation, a model’s lofty performance metrics may be nothing more than a statistical mirage (Kohavi, Henne and Sommerfield, 2007). This section dives into proven techniques like pilot programs, A/B testing, champion-challenger comparisons, and ROI measurements to ensure that your shiny new model actually delivers on its commercial promise.
Validation goes beyond a mere check of statistical rigor. It is an opportunity to confirm that the model drives key metrics such as ROI, cost savings, revenue growth, or customer satisfaction (Davenport, 2018). While data scientists might get giddy over cross-validation scores or confusion matrices, executives often care about how these improvements translate into tangible results. For instance, shaving a few percentage points off predictive error may look impressive in a technical report, but if it fails to move the needle on customer retention or operational costs, the model risks irrelevance. Proper validation ensures that you do not unknowingly adopt a model that looks spectacular in a laboratory setting but fails in actual production.
The notion of a pilot program is straightforward: deploy the model on a limited scale or in a controlled environment to observe its real-world impact before you bet the farm on full-scale adoption. A retailer might introduce a new inventory forecasting system in one region, or a bank might deploy an AI-driven loan-approval workflow in a single branch. By keeping the scope constrained, you minimize risk and can isolate the model’s performance.
During a pilot, qualitative feedback from staff and users can be just as valuable as the quantitative performance metrics. If sales teams are using an AI lead-ranking tool, they can often reveal whether the recommendations feel logical—or if they are outright baffling. In many cases, unforeseen workflow issues surface during the pilot: perhaps the predicted leads are indeed high potential, but the sales portal’s user interface makes it cumbersome to sort or contact them efficiently. When such issues emerge, it is far better for the organization to tackle them in a limited pilot than after a global rollout. From a leadership perspective, pilots act as a safe sandbox to build evidence and rally internal advocates. A well-structured pilot, with clear success criteria—such as a targeted lift in conversion rate—helps executives decide whether to scale the model across the organization.
In digital businesses, particularly e-commerce or online services, A/B testing is often the go-to method for validating a new predictive model (Kohavi, Henne and Sommerfield, 2007). The approach is both elegant and straightforward: randomly split users (or traffic) into two groups, A and B. Group A continues to see whatever the existing system provides (the “control”), while Group B receives predictions or recommendations from the new model (the “treatment”). By running both in parallel, you can statistically measure differences in KPIs such as click-through rates, sales revenue, or churn. If the treatment group significantly outperforms the control group, you have compelling evidence that the model is a commercial upgrade.
Executives often find A/B tests particularly persuasive because the results link directly to real-life metrics. Instead of hearing about a nebulous “1% improvement in F1-score,” they see a concrete lift in revenue or engagement. This approach does require careful planning. You need a sufficiently large sample size to achieve statistical significance, a clear timeline for the experiment, and a method to account for external influences (seasonal trends, marketing campaigns, competitor moves). Still, when done correctly, A/B testing can reveal precisely how much your new model outperforms—or, in some awkward cases, underperforms—your existing baseline.
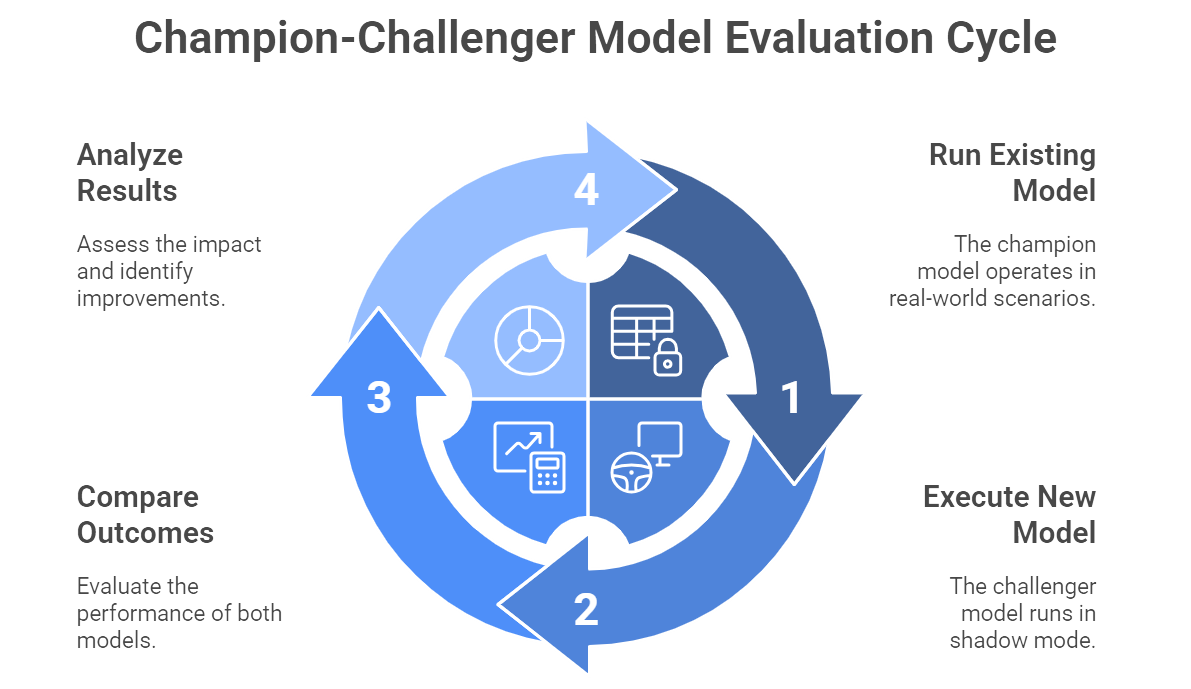
Figure 4: Illustratio of the Champion-Challenger approach where new models are tested in shadow mode and compared against existing ones for optimal performance. (Image by Napkin).
Some models cannot be easily split among different groups of users. For instance, a model that sets prices or determines credit limits might create fairness or regulatory issues if half the population is assigned a new system and the other half remains on an old system. In such scenarios, the champion-challenger approach is often used. The existing model (champion) keeps running live and making actual decisions. Meanwhile, the new model (challenger) runs in “shadow mode,” scoring the same inputs but without real-world consequences. You then compare how the challenger would have performed against the champion, simulating hypothetical outcomes (Davenport, 2018).
In banking, champion-challenger testing is practically a religion, as it allows strict oversight of risk models. A new credit risk model might run in parallel for several months, generating approval and denial decisions for internal review only. If results show a robust improvement—like a lower default rate or higher net profit—then the organization can gradually transition from champion to challenger with confidence. This measured approach protects the business from abrupt shifts in policy and provides a wealth of side-by-side data for analyzing the real impact of adopting the new model.
Regardless of how a model is tested, executives typically demand one final translation: how does this model affect the bottom line? Statistical significance and p-values may warm a data scientist’s heart, but CFOs want to see dollars, euros, or yen (McAfee and Brynjolfsson, 2017). ROI (Return on Investment) often serves as the most direct benchmark, requiring a straightforward (though sometimes tedious) calculation of project costs versus financial gains.
If a pilot reduces manufacturing downtime by predicting mechanical failures in advance, you can quantify how many hours of downtime were avoided and translate that into dollars saved. Subtract the development, deployment, and maintenance costs of the model, and you have a net gain. Executives especially appreciate a neat ratio or multiple: “We spent $200,000 building this predictive maintenance system, and saved $1.2 million in the first year alone.” That sort of clarity has a wonderful way of turning skeptics into enthusiastic allies.
Yet not all gains are strictly monetary. A model might drastically improve customer satisfaction by personalizing product recommendations or anticipating service needs before they cause frustration. Although it is trickier to assign a specific dollar value to intangible benefits like brand equity or user delight, ignoring these factors can be shortsighted. Many organizations adopt a broader scope, tracking “soft” metrics, such as Net Promoter Score or user engagement, alongside more easily monetized outcomes.
A classic case study illustrating the gap between improved accuracy and real ROI comes from Netflix, which famously ran the Netflix Prize competition. Teams worldwide competed to boost the accuracy of its movie recommendation algorithm by 10%, with a $1 million reward up for grabs. A group did indeed achieve the improvement, but Netflix elected not to deploy the resulting model (Netflix, 2009) \[New reference added\]. The complexity of integrating this new, more accurate algorithm was higher than its projected commercial benefit, especially as Netflix’s business model was pivoting from mailed DVDs to streaming during that period. Accuracy did not always correlate with increased viewer satisfaction or retention. This taught the industry a blunt lesson: if your fancy new model does not integrate easily with existing systems or fails to meaningfully shift customer behavior, its improved metrics may be worthless.
In contrast, Netflix has continued to refine in-house recommendation systems that, by their own estimates, save the company over $1 billion per year by reducing subscriber churn (Measuring ROI for Machine Learning and Data Science Projects). That eye-popping figure, often touted in investor discussions, underscores the central thesis of validation: only real-world performance can affirm a model’s actual value to the enterprise.
Even the most sophisticated validation designs can falter if an organization’s culture is hostile to experimentation. Some executives may balk at the notion of running an A/B test on live users or find pilot programs to be a “waste of time” if they are under pressure to deliver immediate results. A healthy data-driven culture embraces iterative experimentation, tolerates short-term risks, and invests in robust validation frameworks. This requires leadership support, cross-functional collaboration, and a willingness to accept that not every model that looks good on paper will pass real-world muster (Davenport, 2018).
It is also vital to involve relevant stakeholders early in the validation process. Domain experts, compliance officers, marketing teams, and IT staff each provide different perspectives on a model’s performance. A champion-challenger strategy that might appear ideal to data scientists could be deemed impractical by compliance if it inadvertently violates consumer protection laws. Conversely, a marketing-driven A/B test might fail to address deeper operational metrics important to operations or finance. Aligning these viewpoints before forging ahead with a pilot or an A/B strategy saves time and headaches down the line.
Even when a model passes every numeric test with flying colors, it can still flop if actual users (internal employees or external customers) refuse to adopt it. Sales teams may ignore a brand-new lead scoring system if they do not understand how it benefits their day-to-day tasks, or if they find the interface cumbersome. Doctors may override an AI-driven diagnosis tool if they feel it conflicts with clinical judgment or lacks interpretability. Hence, user acceptance testing is not just a final formality. It is a critical piece of validation that ensures the solution integrates into people’s workflows and actually gets used.
One practical approach is to embed user feedback loops throughout the pilot or testing phase. Surveys, interviews, or direct observation can reveal friction points that pure data metrics miss. Some organizations even tie adoption incentives or training programs to pilot initiatives, ensuring that employees feel empowered rather than replaced by the new model. If these acceptance hurdles are addressed proactively, the transition to full-scale deployment tends to be smoother, and ROI is more reliably realized.
In the grand tapestry of a data science project, validation is the moment when theoretical gains meet the gritty reality of business operations. From pilot programs and A/B experiments to champion-challenger tests and ROI analyses, the goal is simple yet profound: prove that your model genuinely drives commercial impact (Kohavi, Henne and Sommerfield, 2007; Davenport, 2018; McAfee and Brynjolfsson, 2017). For executives, rigorous validation offers peace of mind—knowing that the shiny new algorithm will improve (rather than sabotage) the bottom line. For data scientists, it provides a necessary sanity check, ensuring that the intricate neural networks or ensemble methods actually function in the real world. And for the entire organization, it fosters a culture of continuous learning and improvement, where each model deployment is a stepping stone toward data-driven excellence.
11.5. Monitoring Models Over Time
The moment a model goes live, it steps into a constantly shifting world where consumer behavior, competitive landscapes, and broader economic conditions can change at a moment’s notice. While deploying a shiny predictive model might feel like a triumphant finale, it is actually the start of an ongoing journey. No amount of modeling sophistication can guarantee that yesterday’s triumph will remain valid tomorrow (Breiman, 2001). This section explores the concept of model drift, the strategies for continuous monitoring, and the cautionary tales of organizations that ignored warning signs until it was too late.
Model drift is the slow (or sometimes abrupt) decay of a model’s predictive power in the face of shifting realities. At a high level, there are two main culprits: data drift and concept drift (IBM). Data drift happens when the statistical properties of your inputs change—maybe your e-commerce site starts attracting a younger demographic with entirely different purchasing habits, or your credit scoring tool suddenly sees more applicants with gig-economy income rather than fixed salaries. A model trained on last year’s data might struggle to handle these new conditions. Concept drift, meanwhile, occurs when the actual relationship between inputs and outputs changes (IBM). A once-reliable pattern may be upended by disruptive events, like criminals shifting their fraud tactics or an unprecedented economic downturn that shatters old assumptions about consumer spending.
Any model that relies on historical data as a guide to future behavior is susceptible to drift. Even the most carefully engineered system can run afoul of new trends or global events—looking at you, COVID-19—if not regularly monitored. Ignoring drift does not just erode predictive accuracy; it can lead to significant commercial setbacks and costly missteps (Gartner, 2021).
Launching a model without a monitoring plan is akin to buying an expensive sports car and never checking the oil. Over time, performance will degrade, often silently, until a catastrophic breakdown. The business consequences range from a slow leak of profits due to flawed forecasts, to major compliance breaches if your credit scoring model starts drifting into discriminatory territory. This is especially problematic in regulated industries like finance or healthcare, where outdated predictions can pose regulatory, ethical, and financial risks.
Effective monitoring strategies generally focus on both data inputs and model outputs. Data drift detection can be as simple as watching certain descriptive statistics—like average customer age or the distribution of purchase amounts—and setting alarms when they deviate markedly from historical norms. Model-output monitoring, on the other hand, compares predicted values to actual outcomes over time to detect creeping error rates (Provost and Fawcett, 2013). Depending on the domain, you might employ real-time dashboards for streaming data, daily or weekly batch reports, or more sophisticated metrics that track the distribution of predictions themselves (for instance, if the average predicted fraud probability surges unexpectedly).
Modern Machine Learning Operations (MLOps) practices emphasize automation and reliability in the model lifecycle. At a minimum, organizations often set up dashboards that show the latest performance metrics against known baselines. If accuracy or recall drops below a predetermined threshold, an alert pings the data science team—and possibly some poor product manager at 2 a.m. Not that the manager would ever thank you for that, but at least the failure will be caught early.
In advanced deployments, retraining pipelines can be partially automated. When the system detects that data or concept drift has exceeded acceptable levels, it can trigger a retraining job using fresh data, deploy the updated model, then run champion-challenger comparisons to ensure the new version is genuinely better. This approach keeps the model evolving with the environment, though human oversight is still crucial. Knee-jerk retraining can just as easily chase random noise if no one bothers to check whether the underlying changes make practical business sense. It is wise, therefore, to implement a gating process—where the newly trained model is tested in a small-scale pilot or champion-challenger scenario before being fully rolled out.
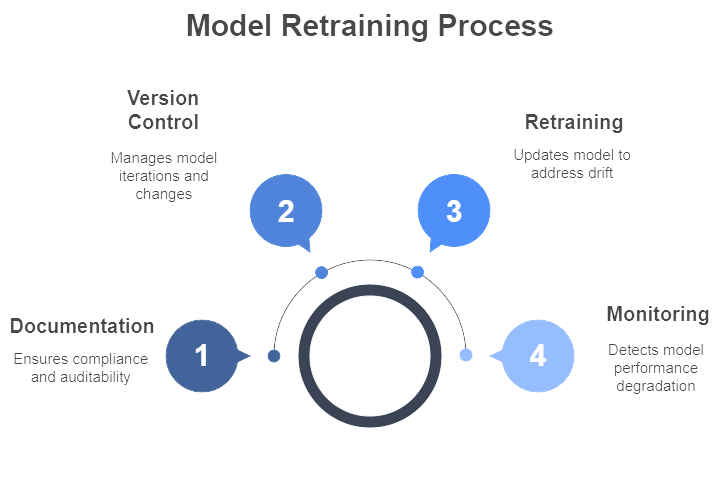
Figure 5: Illustration of the Model Retraining Process, outlining the steps of documentation, version control, retraining, and monitoring to ensure model performance. (I,age by Napkin).
When monitoring reveals drift, retraining the model becomes the next logical step. This retraining can range from a minor data refresh—adding the latest three months of user activity to the training set—to a complete architectural overhaul, particularly if the original design no longer captures the new reality. In either case, version control is paramount. Teams should keep careful records of which data and hyperparameters went into each model variant, along with the performance metrics for each iteration. This rigorous tracking makes it possible to revert to a previous version if the newest model proves unexpectedly brittle. For regulated industries, thorough documentation also provides the audit trail that compliance officers crave.
Google Flu Trends is a classic cautionary tale (Madrigal, 2014). Launched in 2008 to forecast flu outbreaks based on Google search terms, it initially wowed the public and even outperformed official public health data. Over time, however, Google never properly retrained the model to account for evolving search behaviors, algorithmic changes, and seasonal anomalies. By the 2012–2013 flu season, its predictions were off by a staggering 140%. Abrupt data and concept drift had quietly eroded its accuracy, turning a once-heralded innovation into an embarrassing misfire. The lesson is brutally clear: even a tech giant with unprecedented data can fail if it assumes a model’s relevance is eternal.
Equally infamous is the role of outdated financial risk models leading up to the 2008 mortgage crisis. Banks relied on historical data that suggested nationwide declines in home values were rare or minor. When markets collapsed, these models, built on faulty assumptions and never updated to reflect changing macroeconomic conditions, massively understated risk. The fallout was global. Regulators have since mandated ongoing model validation and stress testing (especially in banking), underlining the importance of systematic, periodic reviews. No industry is immune, but financial institutions have learned some lessons the hard way.
COVID-19 also delivered its fair share of drifts. Retailers that used pre-pandemic data for demand forecasting suddenly found themselves with endless stocks of office attire and a shortage of home leisure products. Some quickly pivoted, updating models with new data and shrinking forecast horizons to handle volatile trends. Others stuck with business-as-usual and paid the price in lost sales or inventory blowouts. In a crisis, the ability to rapidly detect and respond to drift becomes a competitive differentiator.
From an executive perspective, monitoring models is not just a technical issue—it is a governance imperative. Someone in the organization must own each production model, reviewing its performance, investigating alerts, and deciding when to retrain or retire it. This governance often extends to forming a cross-functional oversight committee that includes representatives from data science, IT, compliance, and business units. The group sets thresholds for acceptable performance, determines how often models are audited, and aligns model outputs with strategic goals. The process can appear bureaucratic, but it is what keeps your data initiatives from creating public relations fiascos or unforced financial errors.
Failing to integrate model monitoring into broader commercial strategy can result in very expensive lessons. Imagine a recommendation engine that remains oblivious to seasonal changes or holiday surges—pushing winter coats to customers in mid-July or ignoring a sudden spike in interest for sports gear. By the time anyone notices, a swath of disgruntled customers may have jumped ship. In the same vein, a loan approval model might keep spitting out risk scores that reflect five-year-old economic conditions, inadvertently constraining growth or, worse, admitting high-risk borrowers. Constant vigilance is the cure. A well-monitored, regularly updated model is more likely to align with current consumer needs, competitive landscapes, and regulatory frameworks.
Model deployment is not the triumphant final act; it is the opening scene of a long-running performance. Data and concept drift threaten to turn even the best models into misguided relics of a bygone era. By establishing robust monitoring protocols, automated or semi-automated retraining loops, and clear governance structures, organizations can keep models performing at their best (Breiman, 2001; Gartner, 2021; Provost and Fawcett, 2013). The cautionary tales of Google Flu Trends and the 2008 financial crisis serve as sobering reminders: no one—big tech, big bank, or nimble startup—can afford to ignore drift. For executives, the message is simple: budget for monitoring and maintenance as seriously as you budget for model development. A predictive system that is never updated is worse than no model at all, because at least with no model, you will not be lulled into complacency by yesterday’s analytics. Embrace the ongoing evolution of models, and you will turn a once-and-done project into a sustained competitive advantage.
11.6. Strategic Takeaways for Business Leaders
Model evaluation is far from a one-off technical exercise. It underpins broader strategic objectives, ensuring that a company’s investments in data science consistently deliver tangible commercial value (Kuhn and Johnson, 2013). When data initiatives remain aligned with business goals, executives gain the clarity to determine whether to scale up investment, pivot strategy, or even retire models that no longer perform as intended (Davenport, 2018).
Establishing the right governance frameworks, accountability structures, and performance reviews is crucial to keeping models on track. This section outlines key considerations that help leaders integrate AI initiatives into broader commercial planning and operational resilience.
A frequent pitfall in data science is the tendency to build models optimized for purely technical metrics rather than actual business outcomes. Accuracy, F1-scores, or AUC can easily become vanity numbers if they fail to drive real revenue increases, cost savings, or risk reductions. As an executive, it is wise to insist on clearly defined, business-oriented targets from day one. This can mean setting explicit goals—such as reducing churn by 5% or cutting operational costs by a certain amount—and regularly verifying that each model’s performance can be tied back to these targets (InfoQ, undated). When data teams and business stakeholders speak the same language of KPIs, they avoid misalignment and help ensure that the technology genuinely supports organizational priorities.
A well-designed model governance framework prevents AI initiatives from becoming black boxes that no one dares question. Leaders can set up a “data science audit committee” or assign a chief analytics officer to review model performance on a monthly or quarterly basis (McKinsey, 2020). These reviews might cover key performance metrics, risk assessments (e.g., bias checks and error rates), and alignment with ethical standards. Documenting model objectives, version histories, and validation results ensures that if a model underperforms—or causes an unexpected error—there is a clear chain of responsibility and an established escalation path.
Effective governance also addresses how and when humans can override model decisions. If the recommendation engine flags certain customers as “high risk” incorrectly, the affected teams need a protocol for lodging and tracking overrides. Far from being an annoyance, these overrides can serve as invaluable feedback loops that improve model accuracy over time.
A data science project should never conclude with a triumphant “Mission Accomplished” banner. Instead, it requires an iterative cycle of improvement. Even an advanced model that dazzles today might become mediocre a year from now due to shifting data patterns or newly available features. Forward-thinking leaders encourage a culture of experimentation, where “challenger models” are periodically compared against existing “champions.” The evaluation can occur via offline backtesting or controlled A/B tests. If a challenger outperforms the champion in key business metrics—say, it reduces false positives in fraud detection by an additional 2%—then the organization can promote the challenger to production.
This continuous cycle drives innovation and avoids complacency, ensuring that the data science function adapts to new technologies, fresh datasets, and evolving market conditions. An integral part of this process involves allocating sufficient budget for retraining, new feature engineering, and—yes—occasional abrupt pivots when the market rewrites the assumptions on which the model was built.
Many AI projects fail not because the algorithms are subpar, but because the people meant to use them do not trust or fully understand their recommendations (PMI Blog, undated). Building user confidence requires an investment in data literacy across the organization. Sales managers should have at least a conceptual understanding of how lead-scoring models work, while customer service teams need clarity on what a churn-risk prediction actually means. Inviting domain experts to weigh in on model outputs can also reveal hidden biases or contextual nuances that purely technical teams might miss.
A two-way dialogue between data scientists and front-line staff transforms AI from an opaque directive into a collaborative tool. Doctors may question an AI’s seemingly counterintuitive diagnostic suggestion; fraud analysts might flag anomalies in a new model’s risk scores. These interactions do more than refine predictions. They create a shared sense of ownership that can be vital for the long-term success and adoption of data-driven programs.
Overpromising AI’s capabilities is among the most pervasive mistakes. Rather than claiming that “this model will revolutionize our customer engagement,” it is more prudent to start with realistic goals, then scale up once early milestones are met. Poor data quality or biased datasets are another recurring hazard. Model evaluation should proactively address these issues by testing for fairness, representativeness, and alignment with real-world distributions.
It is also crucial not to neglect change management. If a model disrupts existing workflows—say, by automating decisions that were once made by human experts—there can be pushback. Communicating the rationale, offering training, and providing safety nets (like human-in-the-loop checks for high-stakes decisions) can mitigate resistance and ensure smoother transitions. Underestimating the cost of ongoing maintenance is another pitfall. Without setting aside resources to retrain and recalibrate models periodically, organizations risk letting their AI degrade to the point of irrelevance or, worse, do harm by generating outdated recommendations (PMI Blog, undated).
The true power of AI emerges when organizations treat models as catalysts for strategic evolution. If a churn model reveals that the company’s highest-value clients are leaving due to slow customer support, executives might restructure the entire support function or introduce premium-tier services. If a new forecasting system finds that a specific region is significantly more profitable than expected, leadership might shift distribution priorities to target that region. In this manner, model evaluations do not merely confirm whether a system “works.” They spark decisions that reshape business processes, customer experiences, and competitive positioning.
Conversely, if strategy shifts, the models must also adapt. Moving from enterprise customers to small and medium-sized businesses, for instance, requires different data sources, updated logic, and possibly new success metrics. Keeping data teams in the loop on strategic pivots helps them anticipate necessary changes to the models—or build entirely new ones.
Although immediate ROI is crucial, long-term consequences should not be overlooked. AI-driven personalization may boost short-term sales but could irritate customers if they feel bombarded or manipulated, leading to brand damage over time. Similarly, leaders must ensure that models meet ethical and regulatory standards, especially as governments enact more AI-specific guidelines around transparency, data privacy, and anti-discrimination. Being proactive in addressing these concerns is not just a moral imperative; it is often a strategic advantage that fosters public trust (McKinsey, 2020).
Effective oversight involves periodically reviewing models against an evolving ethical and regulatory landscape. It may also require investing in interpretability techniques, bias audits, and consumer-facing explanations of how AI-driven decisions are made. By championing these practices, executives safeguard their brands and position their organizations as responsible innovators in an era increasingly shaped by data and AI.
Strategic oversight of AI and machine learning initiatives is not about hovering over data scientists with an iron fist. Rather, it is about setting a clear vision, establishing transparent accountability, and fostering a culture of continuous learning. When executives link model outcomes to concrete business objectives, maintain robust governance structures, and encourage iteration, data science ceases to be an isolated technical function and becomes a genuine engine for enterprise growth (Kuhn and Johnson, 2013; Davenport, 2018). Along the way, leaders must remain vigilant about common pitfalls, champion stakeholder involvement, and stay open to pivoting when market shifts or ethical considerations demand it. The result is a data-driven ecosystem where models routinely deliver value, adapt to changing conditions, and ultimately strengthen the company’s competitive edge in a rapidly evolving commercial landscape.
11.7. Conclusion and Further Learning
Evaluating and interpreting model performance is where data science meets business reality. In this chapter, we highlighted that a model’s true worth lies not in an isolated accuracy metric, but in its impact on business objectives and decisions. By selecting the right performance metrics (precision, recall, AUC, etc.) aligned to what the business values, and by employing explainability tools to make AI’s workings transparent, organizations can bridge the gap between complex algorithms and actionable insight. We saw that rigorous validation—through pilots, A/B tests, and ROI analysis—provides confidence that a promising model will actually move the needle in production. Yet, the work doesn’t end at deployment: continuous monitoring for drift and disciplined retraining are essential to sustain performance in a changing world. For business leaders, the strategic takeaways are clear. Success with AI requires alignment, oversight, and a culture of continuous improvement. When model evaluation is woven into the fabric of business strategy, companies can harness machine learning in a controlled, effective, and ethical manner. In sum, a model is not just a piece of software but a living decision-making asset. Its performance must be judged in the context of business outcomes, understood by those who rely on it, validated in the real world, and nurtured over time. Mastering this process is key to translating data science prowess into durable competitive advantage and tangible business value.
To deepen your understanding of evaluating and interpreting model performance, consider the following thought-provoking prompts. These questions and scenarios are designed to encourage reflection, discussion, and exploration beyond the chapter. They will help solidify key concepts and reveal how you can apply these ideas in real business situations. As you work through each prompt, think about the practical implications and the rationale behind each answer. (A brief conclusion follows the prompts, tying together the learning outcomes.)
Business vs. Technical Success: Imagine a model that has extremely high accuracy in predicting customer churn on historical data. However, when deployed, the business’s churn rate doesn’t improve. What might explain this discrepancy, and what steps would you take to investigate and resolve it?
Metric Selection: Your team built a medical diagnostic model for a disease that affects 0.1% of the population. Which is more important to emphasize – precision or recall – and why? How would an overemphasis on the wrong metric potentially harm patients or the healthcare provider?
Precision-Recall Trade-off: In a fraud detection system, increasing the threshold for flagging fraud will reduce false positives but might let more fraud cases slip through. Describe a process for determining the optimal threshold. What business inputs (like cost of investigation vs. cost of fraud) would you need, and how would you find the balance?
Explainability Demand: A bank is using a complex AI model for credit decisions, but regulators demand an explanation for each rejection. What tools or strategies can the bank use to provide understandable explanations? Discuss at least two methods and their pros/cons (for example, LIME vs. using a simpler model).
Bias Detection: You have a model that recommends higher pricing for certain neighborhoods in a city. How would you evaluate if the model is exhibiting bias or redlining (price discrimination that correlates with protected attributes)? What data or tests would you use, and what actions might you take based on the findings?
A/B Test Design: Your e-commerce company wants to test a new recommendation algorithm. Outline an A/B test plan: how will you split users, what metrics will you measure (e.g., click-through rate, conversion), how long will you run the test, and how will you decide if the new model “wins”?
Negative A/B Test Result: Suppose your A/B test shows the new model did not improve the primary metric. What could be some reasons for this outcome despite the model performing well offline? List at least three hypotheses (e.g., model interference with user experience, training-serving data mismatch, etc.) and how you might investigate each.
ROI Calculation: A predictive maintenance model costs $500k to develop and saves an estimated 1,000 hours of downtime. If an hour of downtime is valued at $1,200 in lost revenue, calculate the ROI. How would you present this to the CFO in terms of payback period or annual savings?
Model Drift Signs: You notice the accuracy of a live model has been dropping 1% each week for several weeks. What are the first steps you take to diagnose whether this is due to data drift, concept drift, or some technical issue with the model? Outline a troubleshooting approach.
Data Drift vs. Concept Drift: Provide an example of data drift and an example of concept drift in the context of a ride-sharing service’s demand prediction model. How might each type of drift manifest in the model’s predictions?
Monitoring Dashboard: If you were to design a dashboard for executives to monitor a deployed model’s health, what key metrics or indicators would you include? Consider metrics related to input data, model outputs, and outcomes. Explain why each is important.
Human Override Policy: In a scenario where a model suggests denying a high-value customer’s request (for example, an insurance claim), under what conditions should a human be allowed to override the model? How would you incorporate human-in-the-loop feedback into improving the model over time?
Interpretable vs. Black Box: You have the option to use a simple linear model or a complex ensemble for a marketing response prediction. The complex model is 5% more accurate. Construct an argument for choosing the simpler model in terms of business value (think transparency, ease of implementation, regulatory comfort, etc.). Now construct the counterargument favoring the complex model (think revenue lift, competitive edge).
Fairness in Model Performance: After deployment, you find your model performs significantly better for one segment of customers (say, urban users) than another (rural users). What steps would you take to address this disparity? Discuss whether you would retrain the model, collect more data, or perhaps maintain separate models for different segments.
Scenario Planning: How would you stress-test a model’s performance for extreme scenarios? For example, test a demand forecasting model for a sudden market shock or test a credit risk model against a recession scenario. Why is this kind of “what-if” evaluation useful for strategic planning?
Model Sunsetting: If an AI model has been in production for several years, how do you decide when it’s time to retire or replace it? What factors would you consider (e.g., performance degradation, availability of better algorithms, changes in business strategy)?
Communication to Stakeholders: Draft a brief explanation you would give to a non-technical executive on why a high AUC doesn’t automatically mean a model is good for business. Use an analogy or simple scenario (for instance, predicting something very rare) to illustrate the point.
Incorporating Feedback: Your sales team reports that some leads the model marked as “low priority” have actually turned into big clients. What does this feedback imply about the model? How would you update the evaluation process or the model itself to account for such missed opportunities?
Balancing Innovation and Stability: As a leader, how do you encourage your data science team to experiment with new models and techniques (which might improve performance) while also ensuring the current production models remain stable and reliable? What processes or culture would you put in place?
Ethical Consideration Prompt: You can deploy a model that will significantly improve profit but at the risk of reducing transparency to customers (for example, a pricing model that customers might perceive as unfair). How do you evaluate this decision? Discuss the ethical and long-term business implications and whether there are creative solutions to get both profit and transparency.
Concluding Note: By engaging with these prompts, you explore the multifaceted nature of model evaluation – from technical diagnostics to strategic decisions and ethical considerations. The key insights to carry forward are that effective model performance management requires both quantitative analysis and qualitative judgment, and that successful business deployment of AI is as much about people and process as it is about code and data. Continually asking questions like the ones above in your projects will ensure a deeper understanding and a more robust integration of machine learning into business strategy.
Applying the concepts from this chapter to real-world-style tasks will reinforce your learning and give you hands-on experience in bridging technical and business aspects of model evaluation. Below are five practical assignments. Each assignment includes a scenario and detailed guidance on how to approach it. These exercises are meant to simulate challenges you might encounter in a business setting and encourage you to think through solutions step by step.
🛠️ Assignments
📝 Assignment 1: Define Evaluation Metrics for a New Project
🎯 Objective:
Design and select performance metrics for an AI model that prioritizes incoming customer support tickets, ensuring the chosen metrics directly align with the company’s goals (e.g., reducing response time for urgent tickets and maintaining customer satisfaction).
📋 Task:
Identify at least three relevant evaluation metrics (for example, precision/recall for detecting urgent tickets, average resolution time for top-priority issues, or a business outcome measure such as SLA breach rates). Explain how each metric connects to the support organization’s commercial or operational objectives. Outline how you would collect or simulate the data needed to calculate these metrics before deployment.
💡 Guidance:
Begin by clarifying the company’s definition of “urgent.” If labels don’t exist, coordinate with domain experts to label a sample of tickets for testing. Compute precision and recall to see how well the model distinguishes urgent from non-urgent tickets, and consider a business outcome metric (like customer satisfaction on resolved tickets). Whenever possible, quantify how improved triage might reduce costs or speed up resolution times. This exercise will reinforce the importance of linking technical performance (like recall) to real-world impact (e.g., fewer escalations, happier customers).
📝 Assignment 2: Perform a Confusion Matrix Analysis
🎯 Objective:
Interpret a binary classification model’s performance through standard metrics—accuracy, precision, recall, and F1-score—and tie these results to a specific business setting (e-commerce purchase predictions).
📋 Task:
Using the confusion matrix results (50 true positives, 45 true negatives, 5 false positives, 10 false negatives), calculate and report accuracy, precision, recall, and F1-score. Then, interpret these findings in terms of missed opportunities, marketing costs, and potential adjustments to the model’s threshold or targeting strategies.
💡 Guidance
Begin by computing each metric: Accuracy = (TP + TN) / (TP + TN + FP + FN). Precision = TP / (TP + FP). Recall = TP / (TP + FN). F1-score = 2 × (Precision × Recall) / (Precision + Recall). Explain the business implications: missed purchasers represent lost revenue, while false positives might drive unnecessary marketing spend. Recommend whether the company should aim for higher recall or higher precision, considering the cost of promotional offers versus the cost of missing a sale. This step trains you to connect raw performance metrics to actual e-commerce outcomes and strategies.
📝 Assignment 3: Create an Explainability Report
🎯 Objective:
Communicate the reasoning behind a black-box model’s decision in simple, actionable terms, using insights from an explainability tool (e.g., LIME or SHAP).
📋 Task:
Draft a brief (3–4 sentence) explanation of why a loan application was rejected, referencing key factors such as debt-to-income ratio and credit score. Propose one concrete step the applicant might take to improve their approval odds in the future (e.g., reduce debt, add a guarantor).
💡 Guidance:
Translate the AI’s local explanation into language that a non-technical loan officer or applicant can understand. Focus on clarity rather than technical jargon: for instance, “The high debt-to-income ratio signaled high risk, and a low credit score contributed to the rejection. However, adding a guarantor or choosing a shorter loan term could significantly reduce the risk profile.” Avoid judgmental phrases, and finish with a concise suggestion for how the applicant might address these issues (e.g., paying down debt). This exercise builds the vital skill of bridging complex AI insights with user-friendly recommendations.
📝 Assignment 4: Plan a Model Monitoring Strategy
🎯 Objective:
Develop a systematic monitoring plan for a newly deployed demand-forecasting model in a chain of restaurants, ensuring the model stays accurate and relevant over a six-month horizon.
📋 Task:
Specify the data you will collect (e.g., daily predicted vs. actual demand), the metrics you will track over time (e.g., MAE, MAPE), and the thresholds or triggers that would prompt retraining or further investigation (e.g., MAPE over 15% for two consecutive weeks, sudden shifts in customer counts).
💡 Guidance:
Establish automated pipelines that capture daily or weekly model predictions and actual outcomes. Calculate error metrics regularly and set alert thresholds for data drift or consistent under/over-forecasting (for instance, if the model routinely underestimates dinner demand by more than 20%). Incorporate seasonality considerations (e.g., holidays) and plan to retrain right after major events if patterns change. Include both quantitative markers (error rates) and qualitative input (feedback from restaurant managers). This assignment underscores the importance of sustaining model quality post-deployment.
📝 Assignment 5: Conduct a Post-Mortem on a Model Failure
🎯 Objective:
Analyze why a churn-prediction model for a subscription service failed to reduce actual churn, even though its prediction accuracy was high, and propose targeted fixes for each identified root cause.
📋 Task:
List three plausible reasons the model might have disappointed in practice—for example, the intervention was ineffective, timing of predictions was too late, or unforeseen external factors invalidated historical patterns—and suggest one improvement for each. Summarize how these issues highlight the need for aligning prediction with meaningful action.
💡 Guidance:
Consider scenarios such as a generic discount offer that failed to retain users, a model that flagged churn risk only after customers had mentally “checked out,” or model drift caused by new competitors. Propose concrete solutions, like testing a range of personalized retention strategies rather than a blanket discount or retraining the model with updated data including new behaviors. Note that even the best predictive accuracy cannot help if the wrong interventions or timings are used. This post-mortem approach illustrates that success in AI depends on the feedback loop between model predictions and real-world actions.
By completing these assignments, you’ve exercised key skills: setting evaluation metrics aligned with objectives, interpreting model outputs in business terms, communicating explanations, designing monitoring regimes, and diagnosing failures. These practical applications reinforce the chapter’s core message: effective model performance evaluation is holistic, blending technical measures with business insight and proactive management. Each assignment’s scenario mirrors common challenges faced when integrating AI into business processes, preparing you to handle them with confidence and clarity.
Comments