Chapter 5
Analytical Techniques and Modeling Approaches for Business
"Information is the oil of the 21st century, and analytics is the combustion engine." — Peter Sondergaard
Business analytics leverages data-driven models to inform strategic decisions across industries. This chapter demystifies four key analytical techniques – classification, clustering, regression, and forecasting – in practical business terms. We explore how each modeling approach works conceptually and how it drives value in finance, retail, healthcare, FMCG, distribution, and logistics. Non-technical executives will gain insight into fundamental principles (what the models do and how they learn from data) and real-world applications (how companies use these models to segment customers, predict outcomes, and optimize operations). Through industry-specific case studies and examples, we illustrate how classification models flag risks and opportunities, clustering techniques reveal hidden customer segments, regression analysis quantifies key business drivers, and forecasting methods anticipate future trends. Together, these sections provide a comprehensive yet accessible foundation in analytics, empowering business leaders to collaborate effectively with data science teams and harness predictive insights for competitive advantage.
5.1. Classification Models in Business Analytics
Classification models rank among the most widely deployed machine learning techniques in modern enterprises. While some executives may find the term “classification” about as exciting as a lengthy compliance memo, these algorithms can be game-changers for organizations seeking data-driven advantages. When done correctly, classification transforms raw data into crisp, actionable insights that guide decision-making at scale. Whether it is identifying fraudulent credit card activity in near real time or predicting which online shoppers are on the brink of abandoning their carts, classification algorithms lie at the heart of efficient and profitable business operations. In this section, we will traverse the basics of classification, explore why these models matter in a commercial context, and examine their real-world impact through finance, retail, FMCG, and healthcare examples.
Classification is a supervised learning approach that assigns new observations to one of several predefined categories, based on patterns learned from historical data (Keylabs). The process typically begins with a labeled dataset in which each instance (such as a transaction or customer record) is tagged with the correct class label. During training, the model digs through these examples, detecting relationships between input features—income levels, product prices, website clicks—and the final class label. Once trained, the model can analyze a fresh data point (for which the outcome is unknown) and predict the most likely category, often accompanied by a probability score. This workflow seamlessly addresses binary decisions (“approve loan or deny loan?”) or more nuanced queries (“which of the seven product categories is this item likely to belong to?”), making classification a versatile tool in commercial analytics (IBM).
Organizations often grapple with high-stakes decisions that require rapid, consistent, and accurate judgments. Classification models excel at distilling enormous, messy datasets into simple yes/no or multi-category outcomes, which can then be interpreted by even the most data-averse executive. By automating these repeated decisions, companies reduce the risk of human bias and free up skilled staff to tackle more strategic tasks. Fraud detection is a classic illustration: rather than expecting analysts to pore over thousands of transactions every minute, a well-tuned model flags suspicious activity for deeper investigation, ensuring real-time protection. Because classification systems operate at machine speed, they can effortlessly handle millions of data points, offering scalability that manual processes would never match (Keylabs). Moreover, classification fosters consistency. When a model labels a transaction as “risky” at 3:00 a.m., it applies the same criteria it would at 3:00 p.m., eradicating the subjectivity that can creep into human-led evaluations and enabling business operations to maintain a uniform standard of decision-making around the clock.
Popular methods include logistic regression, decision trees, random forests, support vector machines, and neural networks (IBM). Logistic regression remains the most straightforward: it calculates the odds of belonging to a certain class (like “default” in a credit risk scenario) and is valued for its interpretability—executives can easily see how each predictor impacts the final probability. Decision trees split the feature space using if-then rules, producing a flowchart-like structure that can be understood even without a PhD in data science, though they sometimes overfit the training data. Random forests and gradient-boosted trees aggregate multiple decision trees to achieve higher accuracy and better generalization, albeit at the cost of interpretability. Support vector machines draw optimal boundaries in feature space for classification, potentially capturing complex, non-linear relationships. Finally, neural networks, especially deep learning variants, tackle large-scale tasks—from image recognition to text classification—with notable success, though they can be less transparent in explaining how they arrived at a given verdict. In practice, businesses tend to start with simpler, interpretable models before graduating to advanced ensembles or neural networks, especially if the stakes are high or regulatory requirements demand clarity in decision-making (Keylabs).
Few industries have embraced classification as enthusiastically as finance. Credit scoring models determine whether an applicant is likely to repay a loan, often using factors like credit history, employment data, and existing debts. Logistic regression has historically dominated this field due to its simplicity and robustness, but advanced algorithms like gradient-boosted trees are increasingly common, pushing accuracy rates higher than ever (Keylabs). Fraud detection systems similarly classify transactions or accounts as “fraudulent” or “legitimate.” Given that over half of organizations have encountered fraud in the past two years—according to some surveys, the highest level in two decades (PwC, 2022)—this application is mission-critical. Payment processors rely on classification models scanning real-time data for red flags, such as an unusual location or sudden spike in transaction amounts. Some decision-tree ensembles reportedly catch over 96% of fraudulent charges, even in heavily imbalanced datasets (Keylabs). In credit risk, advanced machine learning approaches such as XGBoost can achieve upward of 99% accuracy in predicting customer defaults (Anon). These gains illustrate the potential of modern classification techniques to save financial institutions millions in losses and enhance risk management.
In retail, few metrics matter more than customer retention. Classification models help forecast which customers are about to churn—cease buying from a particular brand or store—and which are still engaged. By analyzing a range of historical interactions—frequency of purchases, responsiveness to promotions, time since last transaction—companies can classify each account as “at-risk” or “safe” (IBM). Armed with these insights, marketing teams launch targeted re-engagement campaigns, leveraging discounts or special offers to retain wavering customers. For Fast-Moving Consumer Goods (FMCG), classification often zeroes in on distribution efficiency. Manufacturers group retail outlets into categories (A, B, or C) depending on factors like sales volume and floor space, then tailor field sales efforts accordingly (Geovision Group). A-class outlets might receive premium promotions and faster restocks, while lower-tier outlets get more basic support. This classification approach ensures the optimal allocation of limited sales and logistics resources. Indeed, one FMCG player reported notably improved ROI after re-strategizing its promotions to target the most lucrative “A” outlets (Geovision Group). Whether the objective is preventing customer churn or refining distribution, classification in retail ensures each segment receives precisely the attention it warrants.
Healthcare organizations also draw significant value from classification. Machine learning models sort patients into categories like “benign” vs. “malignant” when interpreting medical scans, or “high-risk” vs. “low-risk” when predicting complications. In one study of lung cancer diagnostics, algorithms distinguished malignant from benign lesions with up to 99% accuracy (Anon). Such performance approaches or surpasses expert-level diagnosis, highlighting the potential for classification to enhance early detection and improve patient outcomes. Hospitals similarly use classification to triage incoming patients, assigning each individual a risk score that guides prioritization in emergency departments. By automating part of the triage process, providers can focus their limited resources on the most critical cases. Naturally, data quality, privacy, and cross-functional collaboration with clinicians remain vital for robust models. But when done correctly, classification can literally save lives by accelerating intervention times and reducing the burden on overwhelmed medical staff.
Despite the allure of classification’s swift, categorical clarity, pitfalls loom for those who dive in unprepared. Training data must be meticulously cleaned and representative. A single overlooked data quality issue—like duplicated records or missing labels—can skew results and derail the model’s credibility. Organizations also need to define success metrics carefully. In fraud detection, for example, a high recall rate is essential to catch as many fraudulent cases as possible, but an overly aggressive model may flag legitimate transactions, causing unhappy customers. Collaboration between data scientists and domain experts is crucial, ensuring that the features selected for the model actually align with business logic. The finance team, marketing leads, or clinicians who deeply understand the domain should weigh in on the final interpretation of outputs. Moreover, once deployed, classification models demand ongoing monitoring and maintenance. Market dynamics shift, consumer behaviors evolve, and medical guidelines get updated, meaning the model’s performance can drift over time if left unattended (Keylabs). Securing executive sponsorship to fund continued iteration is essential.
Classification is more than a flashy machine learning buzzword; it is a practical, high-impact approach that helps organizations navigate countless decisions, from approving loans and combatting fraud to retaining customers and diagnosing illness. When anchored by strong data governance, thorough quality checks, and cross-functional collaboration, classification models not only generate immediate benefits—like cost savings and higher customer satisfaction—but also pave the way for more advanced analytics initiatives. Companies that master classification techniques lay a foundation to explore deep learning, real-time AI, and other cutting-edge approaches, continually pushing the boundaries of what data-driven strategy can achieve. For executives aiming to blend analytics into every aspect of commercial operations, classification is a natural and often indispensable point of entry.
5.2. Clustering Techniques for Insights and Segmentation
Clustering belongs to a family of unsupervised learning techniques that aim to uncover natural groupings in data without requiring predefined labels (Data Science for Health Informatists). In simpler terms, it is how we find structure in what initially seems like chaos—imagine looking at a scatterplot of thousands of points and identifying which points “flock together” based on similarity measures such as distance or density. Unlike classification, where each data point is assigned to a known category (such as “fraud” or “not fraud”), clustering lets the data speak for itself, revealing hidden segments you might not have anticipated. For business leaders, this amounts to discovering surprising patterns in customer behavior, product usage, or operational metrics—insights that frequently lead to strategic shifts or competitive advantages.
Clustering answers a deceptively simple yet powerful question: “What natural segments or patterns exist in my data?” No matter the industry—be it retail, healthcare, finance, or logistics—organizations grapple with large, messy datasets. Treating all customers, patients, or supply chain nodes as identical leads to bland, one-size-fits-all strategies. Clustering carves out homogenous groups, enabling companies to tailor marketing approaches, product offerings, or resource allocation to each cluster’s unique characteristics. This approach often outperforms guesswork or rigid segmentation rules conceived in a boardroom. By letting the algorithm define group boundaries, executives get a more objective lens on their operations, one free from the constraints of preconceptions. Done right, clustering can be both an exploratory and a strategic tool—uncovering everything from niche consumer subcultures to under-the-radar service issues that hamper efficiency.
Popular clustering techniques include K-Means, hierarchical clustering, and DBSCAN. K-Means partitions data into a specified number K of clusters by minimizing variance within each group. It is fast and intuitive but requires you to guess K in advance. Hierarchical clustering constructs a tree (or dendrogram) of clusters, making it easier to explore multiple grouping levels. DBSCAN eschews a fixed number of clusters, instead identifying clusters based on local density—a boon when data contains unusual shapes or outliers (Data Science for Health Informatists; Data Science for Health Informatists). Regardless of the algorithm, the output is a set of cluster assignments—basically a fresh label for each data point, indicating which “tribe” it belongs to. The real strategic payoff arrives when analysts interpret these labels and reframe them in business terms, such as “bargain hunters,” “frequent transactors,” or “high-risk patients.”
Few industries illustrate the value of clustering better than retail. Rather than bombarding every shopper with the same promotions, retailers can cluster their customers by purchase behaviors, demographic data, and interactions across channels (Anon). It is not uncommon to discover that a seemingly monolithic “customer base” actually contains several distinct personas—price-sensitive families, tech-savvy millennials, bulk-buying households, and so on. Targeted marketing campaigns to these clusters can yield higher conversions and, more importantly, happier, more loyal customers. Likewise, FMCG firms often classify retail outlets or distribution points by traffic patterns, location, or local preferences. One global supermarket chain famously increased sales after clustering its stores into categories like “urban high-traffic,” “suburban family,” and “rural low-volume,” then aligning inventory and promotions with each store type’s unique demands (Solvoyo). This data-driven approach avoided the pitfall of applying identical stocking rules across vastly different locales, revealing how local context shapes purchasing patterns and product success.
Healthcare has rapidly embraced clustering for patient segmentation, especially as electronic health records and wearable technologies generate ever more data. By grouping patients based on shared characteristics—such as lab results, comorbidities, genetic markers, or lifestyle factors—providers can tailor interventions more precisely (Data Science for Health Informatists). One hospital system, for instance, discovered that patients with congestive heart failure actually split into subclusters with distinct risk profiles. Some might benefit most from medication reminders, while others need immediate lifestyle interventions. Identifying these clusters made it possible to allocate resources more efficiently, focusing critical care on those who needed it most. In other scenarios, clustering can isolate anomalous patient profiles, aiding in early disease detection or triage. The resulting improvements in patient outcomes and cost savings highlight that advanced data science approaches can revolutionize even the most resource-strapped healthcare environments.
In finance, clustering might seem overshadowed by high-stakes predictive models like credit scoring. Yet unsupervised techniques quietly add significant value across areas such as asset management and anomaly detection. A bank that segments its clients or accounts by transaction behaviors can spot outliers that do not align with any established cluster—often an early warning sign of fraudulent activity or money laundering. Similarly, investment portfolios can be grouped by factors such as risk tolerance, market exposure, and liquidity preferences, revealing which customers or assets might benefit from specific advisory services. Such clustering also helps compliance teams manage regulatory obligations more intelligently, focusing audits on outlier clusters that deviate from known patterns, rather than wasting time verifying routine, low-risk segments.
Logistics often suffers from an abundance of seemingly random data points—truck routes, shipment volumes, warehouse inventories, temperature settings for perishable goods, and so forth. Clustering brings structure to this chaos. A third-party logistics provider might group shipments by geographic proximity and time-window requirements, then assign specialized teams or technologies to handle each cluster effectively. Similarly, distribution centers can be segmented by the types of products they handle or the frequency of shipments, which allows for more precise inventory planning. Another tactic is identifying outlier distribution patterns that might suggest bottlenecks or tampering. By simplifying operational decisions into well-defined clusters, distribution giants reduce costs and enhance reliability, even under rapidly shifting market conditions.
Despite its exploratory charm, clustering requires careful execution. Choosing the number of clusters in K-Means can be tricky—select too few, and you lump disparate items together; select too many, and your insights might get lost in micro-segmentation. Data preprocessing is another headache, since missing or anomalous values can throw off the distance metrics these algorithms rely on. More advanced approaches like silhouette scores or the elbow method can guide you toward an optimal cluster count, but at the end of the day, domain expertise is essential. A marketing manager or logistics coordinator who can interpret cluster quality is often just as critical as the data scientist who built the model (Anon). Additionally, clusters are not always stable: data shifts over time, and a new cluster can emerge if consumer behaviors or operational demands evolve. Ongoing monitoring ensures the cluster definitions remain relevant—and do not become relics of a past era.
The real impact of clustering surfaces after labels are assigned and business teams start treating those labels as a blueprint for strategy. Retailers might reorganize store layouts or design custom promotional emails. Healthcare providers could reallocate nursing staff or pilot new care pathways for high-risk groups. Finance teams might designate special compliance procedures for outlier clusters or design new mutual funds targeting specific risk-based segments. Cross-functional collaboration is key: data scientists present the clusters, while operational leaders adapt them into real-world tactics. This synergy is often the make-or-break factor for achieving ROI on advanced analytics initiatives. As many organizations have learned the hard way, a brilliant cluster analysis that sits on a server, untouched by decision-makers, is about as useful as last year’s office memo.
When executives complain about the complexity of their data—endless sales logs, reams of patient records, or labyrinthine transport schedules—clustering emerges as a potent antidote. It translates raw information into tangible, comprehensible groupings, bringing order to the chaos. Whether you are segmenting customers for targeted marketing, categorizing patients for personalized care, or optimizing distribution networks, clustering offers a data-driven approach to discovering meaningful patterns (Data Science for Health Informatists). Done thoughtfully, it enables more efficient operations, more satisfied customers, and—here is the kicker—an edge over competitors who still treat every customer or shipment as basically the same. In an economy that demands increasingly personalized experiences and hyper-efficient logistics, ignoring clustering is a missed opportunity. It is a technique that merges advanced analytics with common sense: find similar things, treat them similarly, and watch your performance metrics trend upward.
5.3. Regression Analysis and Predictive Modeling
Regression is one of the most prevalent supervised learning techniques for predicting a continuous numerical value. In simpler terms, it attempts to draw a best-fit line—or sometimes a more intricate curve—through data so that the model can forecast how an outcome (often called the dependent variable) will change as one or more input factors (the independent variables) shift. Classic linear regression might model something like Y = β₀ + β₁X₁ + β₂X₂… + ε, where the coefficients (β₀, β₁, etc.) measure the effect of each input on the outcome. More advanced approaches include polynomial regression for curved relationships and regularized regressions (like Ridge or Lasso) that help control overfitting, especially when the dataset has many predictors. Regardless of which flavor is used, the regression output is a numeric estimate, such as next quarter’s sales, a patient’s length of hospital stay, or the future price of a commodity (IBM). In a commercial setting, regression is ubiquitous for demand forecasting, financial projections, pricing, and risk assessments—any scenario where a continuous metric guides critical decisions.
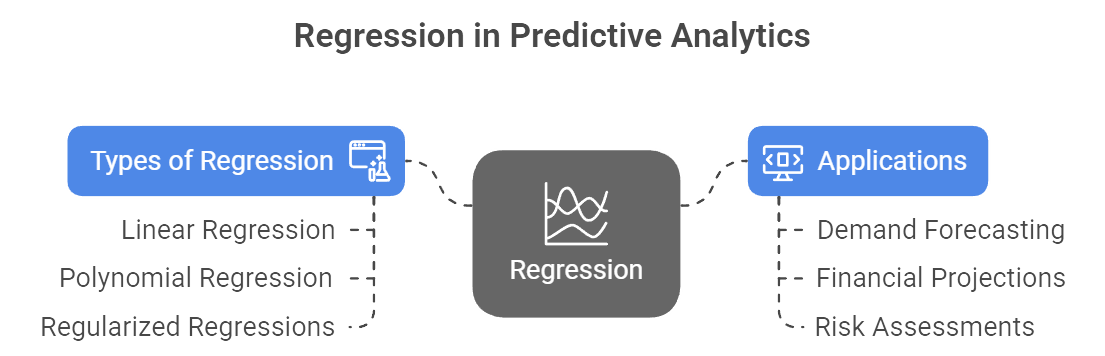
Figure 1: Illustration of the role of regression in predictive analytics, showcasing the relationship between various regression methods (linear, polynomial, regularized) and their applications in forecasting demand, projecting financials, and assessing risks.(Image by Napkin).
An appealing feature of regression analysis is its ability to illuminate the relationships between variables. In linear regression, coefficients show how much the outcome changes, on average, given a one-unit shift in each predictor—holding everything else constant. If a retailer’s regression reveals that for every 1% boost in advertising budget there is a 0.8% rise in revenue, executives can weigh whether scaling ad spend is worth the potential trade-offs. Similarly, an insurer may find that age contributes far more to predicted claim costs than driving history, prompting a reevaluation of underwriting rules. This explanatory power makes regression an ideal tool for “what-if” analysis: decision-makers can plug in hypothetical values for key drivers and observe the forecasted outcome. Although modern machine learning methods (like random forests or neural networks) sometimes deliver higher accuracy, traditional regression remains popular due to its interpretability and transparency—qualities highly valued when high-stakes decisions and regulatory scrutiny demand clarity (MASS Analytics).
Marketing Mix Modeling (MMM) is a textbook case of regression in action. By regressing sales against factors like TV ads, online promos, price levels, and seasonal variables, analysts measure each factor’s relative contribution to overall sales (MASS Analytics). Suppose MMM shows that online ads yield a 3% lift for every $100k spent, while TV ads provide only half that impact. Armed with these insights, marketing departments might reallocate budgets to maximize ROI. When combined with external inputs like GDP growth or competitor activity, regression can become a forecasting engine—“If we boost TV spend by 20% next quarter, how much can we realistically expect sales to grow?” Another high-impact retail application lies in pricing optimization. Regression models can estimate how unit sales vary with price adjustments, giving retailers quantitative estimates of price elasticity. If the model suggests that a 5% price hike drops sales volume by only 2%, the business can strategize around maximizing profit margins while keeping churn minimal (DataCamp). In an era where ecommerce platforms can experiment with dynamic pricing daily, a robust regression strategy can translate directly into bottom-line gains.
Finance departments, from multinational banks to corporate treasury units, rely heavily on regression to project revenue, costs, and credit risk. A shipping company might tie revenue forecasts to macroeconomic indicators like global trade volumes and exchange rates. A commercial lender, meanwhile, uses stress-testing frameworks to see how loan portfolios fare under recession scenarios. In these models, macroeconomic variables—unemployment rates, interest rates, housing price indices—feed into regression equations that estimate default probabilities or net income (Fed). Regulators also demand transparent evidence linking historical data to forecasted outcomes, a requirement that linear and logistic regressions fulfill more easily than opaque “black box” AI models. On the investment side, regression underpins fundamentals like the Capital Asset Pricing Model (CAPM), which calculates a stock’s sensitivity (beta) to market movements. While the finance world often harnesses more complex time-series or machine learning approaches, regression persists as a cornerstone method to understand “if X changes, how does Y respond?” This clarity enables more informed hedging strategies, capital allocation, and risk mitigation, cementing regression’s role as a bedrock of financial analytics.
Regression’s utility extends well beyond sales forecasts. Hospitals leverage regression to predict patient length of stay (LOS), a vital metric for resource planning. By analyzing patient data—age, diagnosis, comorbidities, vital signs—regression models can forecast whether a patient might need a four-day or seven-day stay. Some studies report that such models explain over 80% of the variation in LOS, meaning administrators can better allocate beds, staff, and discharge planning resources (Anon). Another domain is predictive maintenance in manufacturing or logistics: sensor readings like temperature or vibration patterns can feed into a regression model that forecasts when machinery is likely to fail, guiding “just-in-time” servicing to prevent costly downtime. A utility firm might estimate daily electricity demand based on temperature, humidity, and day of the week, refining distribution and load-balancing strategies. Even human resources departments use regression to gauge workforce productivity or turnover risks, factoring in engagement surveys, tenure, and performance reviews. Across these varied applications, the numeric predictions help organizations move from reactive problem-solving to proactive decision-making, while the model coefficients highlight the main levers for improving outcomes.
Despite regression’s versatility, it is hardly foolproof. Overfitting can occur if the model is saturated with too many variables, leading to inflated R² values that do not generalize. Regularization techniques like Ridge or Lasso can rein in these complexities, penalizing large coefficients and thus promoting a simpler model (IBM). Data quality is another Achilles’ heel: outliers, missing values, or inconsistent data definitions can distort regression results. For instance, a mislabeled extreme sale price in a real estate dataset might drag the best-fit line to bizarre conclusions. Business leaders should demand data validation and thorough feature engineering before trusting any model’s projections. Another trap is interpreting correlation as causation. Just because a variable shows a high coefficient does not automatically mean it “causes” the outcome. Effective regression practice involves domain expertise, ensuring that the chosen predictors make logical sense. At the executive level, it is critical to support a cross-functional partnership: data scientists, subject-matter experts, and IT must collaborate to ensure the model’s design aligns with strategic goals and operational realities.
Regression analysis is a means, not an end. The real value emerges when organizations act on their findings—whether it is adjusting a marketing mix, hedging financial risk, optimizing hospital operations, or scheduling machine maintenance. That said, senior leaders often need to champion “regression-based thinking,” embedding it into decision frameworks. This entails requiring data-driven justifications for new budget requests, encouraging scenario planning (“What if interest rates spike?”), and integrating model outputs into day-to-day workflows. Many successful firms maintain agile, iterative approaches, updating regression models as fresh data arrives and adapting them to evolving market conditions. In short, regression is not a one-off project but an ongoing conversation between the business questions executives care about and the data that can shed light on those questions.
While sophisticated AI and deep learning often grab headlines, regression remains an indispensable tool in the commercial analytics toolkit. It is relatively straightforward to implement, interpretable enough for regulatory scrutiny, and robust for many real-world scenarios—particularly when you need to quantify relationships between variables, not just get a prediction. Marketing teams rely on marketing mix models to justify budget shifts. Finance units calibrate risk with scenario-based regressions. Healthcare providers plan resources using predicted LOS, and operations teams schedule equipment upkeep based on regression-based performance metrics. For business leaders who want more than just a black box model—who need to see how each factor influences results so they can make confident, data-driven decisions—regression stands out as a time-tested staple. And as data volumes grow, the synergy between simpler, interpretable regression and more advanced machine learning only amplifies. The future of predictive modeling will likely blend these methods, continuing to underline the importance of regression as an engine for insight and strategic clarity.
5.4. Forecasting Models and Time Series Analysis
Forecasting centers on looking at past data patterns—such as sales, market demand, or shipping volumes—and extrapolating them into the future (Time series forecasting models: Predicting future business trends). While one might argue that nothing in life is guaranteed, many organizations have built a comfortable empire on the premise that past behavior often predicts tomorrow’s results. In data science, these forecasts can be crafted with a variety of approaches, from traditional time series models like moving averages and ARIMA (AutoRegressive Integrated Moving Average) to more advanced ones like gradient boosting and deep learning architectures. The common thread is leveraging historical patterns—trends, cyclical shifts, and seasonality—and blending them with whatever knowledge we have (like upcoming marketing campaigns or economic downturns) to produce a best guess of “What happens next?” For many executives, these forecasts serve as the bedrock for resource planning, production scheduling, and strategic decision-making.
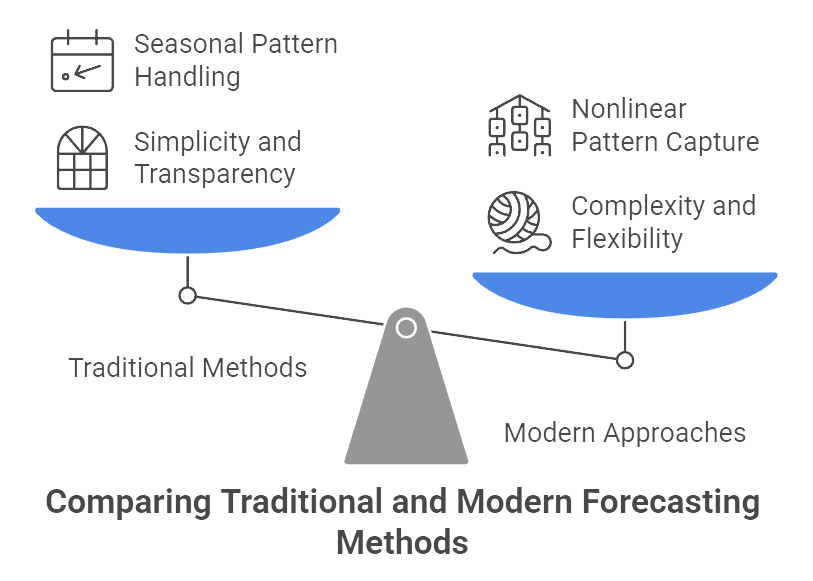
Figure 2: Illustration of how the traditional methods offer simplicity, while modern approaches provide complexity and flexibility for capturing nonlinear patterns.
Although regression can also drive some forecasting tasks, especially when external predictors exist, time series modeling typically uses the target variable’s own past values to anticipate the future. ARIMA, for instance, focuses on how current values relate to their lagged versions (autoregression), differences (to remove trends), and a moving average of residuals. Seasonal ARIMA extends that for data with recurring patterns—like a retail store that predictably sees sales surge each December. Exponential smoothing methods, such as Holt-Winters, weight recent observations more heavily than older ones to quickly adapt to evolving trends. More contemporary tools, like Facebook’s Prophet, automatically handle multiple seasonalities (weekly, annual, holiday effects), making them popular with businesses that want a flexible out-of-the-box solution. Meanwhile, machine learning models like random forests or LSTM networks can capture complex, nonlinear patterns, albeit often at the cost of transparency.
Time series data usually incorporates three main elements: a long-term trend (does demand steadily increase over time?), a seasonal pattern (are there monthly, quarterly, or annual fluctuations?), and irregular or cyclical factors that can be trickier to predict (macroeconomic shocks or one-off events). The goal is to isolate these components and project them forward. Organizations that hone in on these patterns can prevent embarrassing shortfalls—like running out of best-selling items during the holiday rush—or equally embarrassing surpluses of goods nobody wants. It is not merely about convenience. A stellar forecast can differentiate a company that meets customers’ expectations on time, every time, from one that fumbles opportunities or hemorrhages capital in excess inventory (Effective Inventory Management for Sheet Metal Fabricators). As many supply chain experts like to say, “Forecasting is the cornerstone of effective inventory management,” and ignoring that wisdom tends to cause real pain—both in lost sales and in warehousing costs that expand by the day.
Perhaps the most iconic use case: forecasting product demand. Retailers and FMCG companies have long recognized the existential necessity of knowing precisely how much shampoo or cereal customers will buy next week or next month. Walmart, for instance, famously analyzes petabytes of transactional data on an hourly basis, allowing it to adjust store-level inventory with near-surgical precision (OpenStax). This extreme data-driven approach translates into fewer stockouts—and ironically, an unexpected but highly profitable spike in strawberry Pop-Tarts prior to hurricanes. Indeed, Walmart discovered a seven-fold surge in Pop-Tart sales as storms approached and preemptively stocked them, ensuring both a boost to bottom-line and an on-brand public relations story about corporate preparedness. Modern forecasting in retail typically combines time series baselines (to capture seasonal ebb and flow) with machine learning models that factor in promotions, competitor pricing, and local events. The ability to quickly update forecasts based on new data—like a sudden shift in consumer preference or a region-specific holiday—can save millions in wasted inventory while enhancing customer satisfaction.
In the financial realm, forecasting is practically a rite of passage. Corporations project revenues and expenses over quarters or years to guide budgeting. Banks stress test their balance sheets under hypothetical economic scenarios, employing time series regressions to anticipate how loan defaults or trading revenues respond to interest rate changes (Fed). Even entire markets get forecasted: economists fit ARIMA or vector autoregression models to GDP and inflation data, then central banks use those predictions to shape monetary policy. On the investment side, time series analysis also underpins the estimation of volatility, a crucial input for risk management strategies like Value at Risk (VaR). True, forecasting market movements is notoriously prone to error, but it remains indispensable for tasks like capital planning, portfolio rebalancing, and strategic acquisitions. The intangible benefit is not just about nailing a precise number but about quantifying uncertainty and establishing a range of likely outcomes that inform better decision-making. Large public agencies—like airport authorities or city councils—similarly rely on forecasts to predict passenger flows or tax revenues, shaping infrastructure investments and operational staffing years in advance (Macabacus).
If you think about it, every time a global shipping line decides how many containers to place on a vessel, there is a forecast of expected volumes behind that decision. The same goes for a courier service scheduling daily staff based on predicted package counts. When you see Amazon promising faster and faster shipping times, a chunk of that reliability stems from having a well-tuned forecasting apparatus that tells them how many items to stock in each regional fulfillment center, well before demand spikes. Advanced logistics players go a step further by integrating external data—like real-time weather or social media sentiment—into forecasting models that detect potential disruptions or unexpected surges (Predictive Analytics in Logistics: Applications & Use Cases). UPS’s ORION system, for instance, relies on historical package flows to optimize driver routes, anticipating not just today’s volumes but also tomorrow’s. In an era of tight supply chains and just-in-time inventory, these models save millions by slashing fuel costs, cutting unnecessary warehouse storage, and reducing the dreaded “empty miles” phenomenon where trucks drive back empty. Even minor improvements in forecast accuracy can ripple into huge cost savings and a distinct competitive advantage, because customers in a hyper-competitive market expect reliability bordering on clairvoyance.
Despite their promise, forecasting models are no silver bullet. They live or die by data quality. Missing or erroneous historical records can profoundly skew predictions—garbage in, garbage out is painfully relevant here. Many organizations adopt rolling forecast cycles, where monthly or weekly updates revise the model with new data, refining accuracy over time. Model selection is another core consideration: simpler exponential smoothing methods may suffice when patterns are stable, while more complex models become necessary for volatile or multi-seasonal data. Cross-validation approaches (like evaluating predictions on hold-out periods) help confirm a model’s robustness. Equally important is combining quantitative predictions with qualitative insights—marketing might run a big campaign that is not reflected in past data, or an unexpected macroeconomic shift could break the usual patterns. Forecast accuracy also hinges on capturing seasonality thoroughly and adjusting for events like holidays or product launches. Lastly, forecasting is seldom a purely data-scientific exercise. Operational managers, supply chain leads, and finance teams must interpret the outputs and weave them into real-world decisions—like how many shipping containers to send or which inventory levels to maintain. This cross-functional dynamic ensures forecasts do not become theoretical ideas living in spreadsheets but actionable intelligence driving day-to-day operations.
Forecasting does not magically grant crystal-ball knowledge, but it drastically narrows the range of uncertainty. For a retailer, robust demand forecasts mean the difference between a well-stocked store that meets customer expectations and a logistical nightmare of empty shelves or unused stock languishing in warehouses. In finance, consistent forecasting underpins capital management, ensuring a firm maintains adequate liquidity while capitalizing on growth opportunities. In logistics, accurate predictions unlock routes that minimize cost and maximize reliability, all while cutting down on environmental waste from unnecessary miles. Crucially, forecasting is not a one-off project. It thrives as a continuous, evolving process, fed by the latest sales figures, competitor moves, or macroeconomic data, and updated in near real-time. Organizations that treat forecasting as a static function—dusting off the model once a year—often find themselves caught off-guard by swift market shifts or consumer trends. The real winners embed forecasting deeply into corporate culture, equipping cross-functional teams with flexible analytics tools and an appetite for iteration.
Time series analysis and forecasting models are the unsung heroes behind much of the supply chain sophistication and financial planning that define modern commerce. While these tools come with assumptions—like the notion that historical patterns are relevant to the future—decades of experience show that in stable or semi-stable environments, they are invaluable. And even in volatile markets, a well-calibrated forecast provides scenarios and confidence intervals that guide better risk management. Executives who grasp these techniques and allocate resources to build strong forecasting capabilities set their organizations up for a decisive edge. Whether it is anticipating the next holiday sales rush, hedging currency risk, or scheduling a manufacturing line, data-driven foresight often marks the dividing line between operational chaos and profitable efficiency. As technology evolves, expect time series methods to grow even more integrated with real-time data streams and sophisticated machine learning, further sharpening the quest for that “just right” forecast that can propel a business ahead in a fiercely competitive marketplace.
5.6. Conclusion and Further Learning
Business leaders increasingly recognize that data-driven modeling is not just a technical endeavor, but a strategic asset. This chapter has outlined how classification, clustering, regression, and forecasting can be applied across finance, retail, healthcare, FMCG, distribution, and logistics to transform raw data into actionable insights. For non-technical executives, the key takeaways are clear: classification models enable risk mitigation and targeted marketing by sorting entities into meaningful categories; clustering techniques unlock hidden segments and patterns for personalization and efficiency; regression analysis provides both predictions and an understanding of cause-and-effect for informed decision-making; and forecasting models illuminate the road ahead so companies can proactively plan for demand and volatility. Each technique comes with its own considerations – classification and regression require labeled historical data and yield specific predictions, whereas clustering and pure forecasting find structure in unlabeled or time-based data – but all share the goal of enhancing decision quality and business performance with analytics. Leading organizations demonstrate that combining these approaches yields compound benefits (for example, using clustering to segment customers, then a tailored classification or regression model for each segment can greatly improve accuracy and relevance of predictions). To implement these techniques successfully, executives should invest in quality data, foster analytical talent, and promote a culture that trusts and acts on model insights. Moreover, aligning analytical projects with clear business objectives is crucial: models should be developed with a focus on solving concrete business problems (like reducing churn, optimizing inventory, or improving patient care) and their performance should be measured by impact on those goals. In conclusion, companies that effectively harness classification to prioritize actions, clustering to understand their markets, regression to quantify levers, and forecasting to anticipate trends will be far better equipped to navigate complexity and seize opportunities. By building a robust analytics capability around these core modeling approaches, businesses can move from reactive decision-making to a proactive, predictive, and strategic posture – turning data into a sustained competitive advantage.
In an era of data-driven decision-making, curiosity and continuous inquiry are vital. Below is a set of thought-provoking prompts designed to encourage deeper exploration of the concepts covered in this chapter. These prompts can be used to guide discussions with AI assistants or analytics teams, helping to uncover nuanced insights and practical considerations. Each question invites you to delve beyond the basics – examining real-world challenges, comparing methods, or envisioning innovative applications of analytical techniques. By engaging with these prompts, non-technical executives and learners can solidify their understanding, discover new perspectives, and better bridge the gap between data science and business strategy. The value of further exploration lies in moving from knowing what these models do to understanding how and why to use them effectively in specific contexts. Let’s deepen our insight:
Classification vs. Clustering – Use Cases: How do the business use cases for classification and clustering differ? For instance, in customer analytics, when would you prefer a classification model (predicting a yes/no outcome) versus using clustering to segment customers, and what insights does each provide?
Model Selection Strategy: When faced with a business problem (e.g., reducing customer attrition in a telecom company), what factors should an executive consider in choosing between a classification model, a regression model, or a time series forecast? Discuss how the nature of the target variable and business goal influence the choice of analytical approach.
Interpreting Model Outputs: Executives often receive model outputs like confusion matrices, cluster profiles, or regression coefficients. What are the best practices for interpreting these outputs in plain business terms? For example, how would you explain to a board meeting what a 0.85 AUC score means for a fraud detection classifier’s performance, or what a certain cluster of customers signifies in terms of marketing strategy?
Ensuring Data Quality: Analytical models are only as good as the data fed into them. What data quality issues should leaders watch out for before relying on model results? Discuss scenarios like incomplete data in healthcare records affecting a classification model’s accuracy, or how outliers in sales data might distort a regression forecast, and how to mitigate these issues.
Scaling Analytics in Different Industries: Compare how a finance executive versus a retail executive might deploy modeling approaches. For example, explore how regression is used in financial stress testing to relate economic factors to loan losses (), versus how it’s used in retail for marketing mix optimization. What differences in data, regulatory environment, and decision timelines shape the analytics strategy in these industries?
Clustering for Personalization: Many companies use clustering for personalization (product recommendations, personalized medicine, etc.). If a global e-commerce platform clusters its users into 10 segments, what steps should it take to validate that these segments are meaningful and actionable? Discuss how one might label and profile clusters (e.g., “value shopper”, “brand loyalist”) and tailor business actions to each.
Predictive vs. Explanatory Modeling: Business leaders often need both prediction and explanation. How can techniques like regression and decision trees serve both purposes? Consider a scenario with a churn prediction model – how would you balance having a highly accurate but complex model (e.g., a neural network) with a slightly less accurate but interpretable model (e.g., logistic regression) when making business decisions?
Integration of Domain Knowledge: Analytical models do not operate in a vacuum. Provide examples of how domain knowledge or human expertise can be integrated with modeling approaches to improve outcomes. For instance, how might a supply chain manager adjust a purely statistical forecasting model for demand if they know a competitor’s promotion is about to launch? Or how could a doctor’s expertise refine a machine learning classification of MRI images for diagnosis?
ROI of Analytics Projects: For each type of model (classification, clustering, regression, forecasting), discuss how an executive can assess the return on investment (ROI) of an analytics project. What metrics or indicators would show that a forecasting system for inventory is financially paying off? How can one quantify the value of a clustering-driven marketing campaign or a classification-based fraud detection system in terms of cost savings or revenue gains?
Cross-Functional Collaboration: Implementing analytical models often requires business-domain experts and data scientists to collaborate. What communication strategies and collaborative structures help ensure that the models address real business needs? Discuss how an analytics team might work with a retail merchandising team to implement a clustering-based store segmentation, or with risk managers to deploy a new credit scoring model, ensuring buy-in and understanding on both sides.
Ethical and Compliance Considerations: What ethical issues can arise from the use of predictive models in business, and how should executives navigate them? Prompt discussions on topics such as potential bias in classification models (e.g., a credit scoring model inadvertently disadvantaging a certain group), transparency requirements (especially in regulated industries like finance and healthcare), and data privacy (using customer data for clustering/segmentation must comply with privacy laws).
Dealing with Change and Uncertainty: The business environment can change rapidly (new competitors, COVID-19, etc.), which can break model assumptions. How can companies make their forecasting and prediction systems robust to change? Consider strategies like frequently retraining models, using scenario forecasting (multiple what-if scenarios), and having human override mechanisms. For example, how should a retailer adjust its demand forecasts when historical patterns are disrupted by an unprecedented event?
Emerging Trends – AI and Automation: With the rise of AutoML and AI services, how can non-technical executives leverage these to build models without deep technical know-how? Discuss the promises and pitfalls of automated modeling platforms – can a marketing VP safely use an AutoML tool to create a customer churn classifier, and what should they understand about the model’s validation and limitations before trusting it?
Clustering in the Age of Big Data: Clustering traditionally can be computationally intensive for very large datasets. How are modern big data technologies (like distributed computing or advanced algorithms) enabling clustering of millions of records (e.g., segmenting all users of a global social network)? Encourage exploration of tools or algorithms (like MiniBatch K-Means, DBSCAN variations, or even graph-based clustering) that handle large-scale clustering, and what insights a business might gain from clustering at scale that were previously unattainable.
From Models to Decisions – The Last Mile: Once a model (say a sales forecast or a churn prediction) is generated, what processes ensure that this insight is actually acted upon in the business? For example, prompt a discussion on how a demand forecast integrates with inventory ordering systems (perhaps via an ERP software) so that purchase orders are automatically adjusted. Or, how does a sales team use lead scoring from a classification model – do they have dashboards, alerts, or new workflow rules? Essentially, how do we operationalize model outputs effectively?
Comparing Model Performance: Ask how an executive could compare the performance and suitability of different modeling approaches for the same problem. For instance, if given historical data, how would the results differ between applying a regression model vs. a time series forecast for sales, and what accuracy/error metrics would you examine (MAE, RMSE, MAPE, confusion matrix metrics, etc.) to decide which is better for the business context?
Multi-Technique Solutions: Many complex business problems may benefit from a combination of techniques. Encourage thinking about scenarios where multiple models interact. For example, in supply chain management, you might cluster products by demand volatility first, then apply separate forecasting models to each cluster (more stable products vs. highly seasonal products). What are other scenarios (perhaps in customer analytics or finance) where a hybrid approach (clustering + classification, or clustering + regression) can yield superior results?
Model Monitoring and Refresh: Once deployed, how should predictive models be monitored over time? Discuss what an executive should put in place in terms of KPIs or reports to detect model degradation – e.g., a forecasting model whose error is increasing might indicate a shift in trend, or a classification model whose precision drops could signal changes in customer behavior. What governance processes ensure models are periodically reviewed, updated, or retrained to maintain effectiveness?
Case Study Deep Dive: Prompt a deeper analysis of a specific real-world case study mentioned in the chapter. For example: “Walmart’s hurricane prep analytics” – how exactly did they discover the Pop-Tarts pattern and what data mining techniques were used? Or “UPS route optimization (ORION)” – how do predictive models feed into ORION’s prescriptive decision-making, and what challenges did UPS overcome in implementing this analytics-driven system?
Future of Analytics in Business: Encourage a forward-looking discussion on how emerging technologies might change the landscape of analytical modeling approaches. For instance, how might reinforcement learning or real-time streaming analytics play a role in future business decision systems? Could generative AI or advanced simulation complement traditional models (e.g., generating synthetic data to improve a rare-event classifier, or using digital twins to enhance forecasting)? Invite exploration of how the next generation of tools could further democratize analytics for executives or lead to new use cases (such as personalized real-time pricing, truly dynamic supply chain optimization, etc.).
By exploring these questions, you’ll deepen your practical understanding of business analytics and its strategic applications. Remember that continuous learning is key – the more you probe and discuss, the more confidently you can champion data-driven initiatives. Embrace a mindset of curiosity: each prompt you tackle will sharpen your ability to connect analytics with real business outcomes, ultimately empowering you to lead in the data-driven economy. The journey of learning never truly ends, and every insightful query or discussion brings you one step closer to becoming an analytics-savvy leader.
Gaining theoretical knowledge is important, but applying these concepts in real-world scenarios solidifies understanding and builds confidence. The following practical assignments are designed to translate the chapter’s insights into hands-on experience. These exercises do not require advanced technical skills – instead, they focus on strategic thinking, interpretation, and collaboration, which are key for non-technical executives working with analytical models. Each assignment provides a guided opportunity to apply classification, clustering, regression, or forecasting in a simplified but realistic business context. By working through these tasks, you will learn how to frame business problems for analytics, interact with data professionals or tools to develop solutions, and interpret the results to make informed decisions. The goal is to bridge the gap between concept and practice, ensuring that you can confidently champion and utilize analytical techniques within your team or organization. Let’s put theory into practice:
🛠️ Assignments
📝 Assignment 1: Analytical Strategy Case Study
🎯 Objectives:
The goal here is to demonstrate an integrated approach to analytics, using multiple modeling techniques to tackle a realistic business problem. You will show how classification, clustering, regression, and forecasting complement each other in a single strategic plan. This assignment fosters a holistic view of analytics, ensuring you can connect diverse methods to core organizational challenges.
📋 Tasks:
Select a scenario in an industry such as finance, retail, or healthcare, and assume a leadership role (for example, a retail CEO concerned about declining same-store sales). Devise an analytics roadmap that addresses the issue using classification models, clustering, regression analysis, and forecasting. For each technique, specify its purpose, the data required, and the business question it answers. Lay out how the combined insights would guide your decisions and actions. Produce a concise report or presentation (1–2 pages) outlining this roadmap and concluding with recommended next steps for implementation.
💡 Guidance:
When drafting your plan, treat each modeling method as a puzzle piece. Classification might identify which customers are most likely to churn, clustering might reveal geographical or behavioral patterns driving sales drops, regression may pinpoint how factors like price or promotions influence revenue, and forecasting can predict future sales trajectories. Use plain language when explaining how each model links to a concrete business objective. In your final summary, highlight how these insights work together to craft data-backed interventions, whether it is revamping marketing efforts in certain store clusters or adjusting product prices to optimize revenue.
📝 Assignment 2: Data Exploration and Segmentation Exercise
🎯 Objectives:
This exercise aims to sharpen your ability to discover patterns in raw data, particularly using a simple form of clustering or segmentation. You will practice grouping entities—such as customers—into meaningful segments and see how those segments can guide real-world decisions.
📋 Tasks:
Obtain or simulate a small dataset that captures basic attributes of about 100 entities (e.g., customers, products, or outlets). Use a straightforward tool like Excel, Google Sheets, or a basic visualization add-in to group these entities by common features (spending levels, demographics, preferences). Identify 2–3 distinct segments, name them, and describe their main characteristics. Propose a targeted action for each segment—for instance, specialized marketing offers or tailored product assortments—based on the segment’s needs and behaviors. If possible, cross-check your manual segmentation with an automated clustering method for validation and refinement.
💡 Guidance:
Focus on clarity. Even a simple dataset with columns like Age, Annual Spend, or Product Category can reveal meaningful splits if you examine outliers or typical ranges. Challenge yourself to think from a strategic viewpoint: how would you treat Segment A differently from Segment B in a live business context? Summarize your findings in a short document or slide that articulates the rationale behind each segment’s definition and the practical steps you would take to leverage it, such as personalized promotions or product recommendations.
📝 Assignment 3: Predictive Modeling with a No-Code Tool
🎯 Objectives:
This assignment is designed to build confidence with automated or user-friendly analytics platforms, allowing you to create a predictive model without deep programming knowledge. You will learn to interpret model outputs, explore feature importance, and translate those insights into action.
📋 Tasks:
Pick a no-code or low-code analytics solution—perhaps a business intelligence platform with built-in predictive functions or an AutoML tool—and upload a dataset relevant to your context. This dataset could involve marketing campaigns (budget, channels, observed revenue), customer responses (purchase or not), or another scenario where you want to predict an outcome. Follow the tool’s guided steps to train a simple model—whether regression for continuous targets or classification for binary outcomes. Document the model’s performance metrics and identify which factors influence the results the most. Experiment by adjusting some input features to see how predictions shift, revealing levers for potential strategy changes.
💡 Guidance:
Aim to keep things straightforward. Focus on understanding the model’s key drivers—whether it says increasing email marketing yields higher sales, or whether it flags certain demographics as most responsive to your campaign. Capture screenshots or notes of the performance metrics (R², accuracy) and the top features. Conclude with a short explanation in plain language, emphasizing what you discovered and how you might act on it. If the model’s results suggest, for instance, that a channel has negligible impact on sales, outline how you could reallocate budgets or resources accordingly.
📝 Assignment 4: Model Outcome Interpretation and Presentation
🎯 Objectives:
The main objective is to practice translating technical analytics outputs—like precision, recall, or RMSE—into meaningful, executive-friendly recommendations. You will gain skill in bridging the gap between data science details and high-level strategic decisions.
📋 Tasks:
Imagine receiving detailed model results from your analytics team. These might include a confusion matrix, precision-recall stats for a churn model, or forecast accuracy metrics for a demand model. Your mission is to create a brief memo or presentation that interprets these findings for a senior audience. Clarify what each metric means, why it matters (e.g., cost of false positives vs. false negatives), and suggest next steps to leverage the model (like focusing retention efforts on high-probability churn customers). If the model has limitations—perhaps it only identifies 70% of churners—explain the business implications (30% slip through the cracks) and discuss mitigation or improvement options.
💡 Guidance:
Keep it concise and jargon-free. Executives often care more about what to do next than the intricacies of model design. Emphasize business relevance: does an 85% accuracy mean the model is “good enough” to deploy? Should there be a plan to capture more data for better performance? Mention potential negative impacts, such as overreacting to potential churners who might not actually churn. This approach demonstrates that you understand both the quantitative and the operational dimensions of data science.
📝 Assignment 5: Analytics Implementation Plan
🎯 Objectives:
This assignment helps you design a real-world rollout for one of the chapter’s analytical methods. It goes beyond model creation to include data sourcing, stakeholder alignment, and continuous improvement cycles—core elements often overlooked but essential for successful analytics adoption.
📋 Tasks:
Pick a relevant scenario—maybe introducing a new forecasting system for supply chain inventory or employing regression for financial KPI predictions. Devise a phased project plan that covers defining the problem, gathering the right data, choosing a modeling approach, integrating outputs into daily operations, and establishing monitoring protocols. Specify roles, such as who will develop the model and who will act on the results, how you will measure success (e.g., forecast error reduction or increased marketing ROI), and what training or change management steps are needed for a smooth adoption.
💡 Guidance:
Focus on practicality. A brilliant model is worthless if business units ignore or misunderstand its outputs. Ensure your plan explicitly details how results feed into specific processes—like shipping schedules or marketing strategy—and how you will track improvements. Mention potential challenges, such as data quality issues or resistance to new processes, and outline how to address them. Conclude by referencing a timeline or set of milestones, showing you can not only conceive a data science solution but also lead it from concept to embedded operational practice.
By completing these practical assignments, you’ll translate theory into practice and gain confidence in working with analytics in a managerial capacity. As you undertake each task, remember to seek feedback and collaborate – for instance, involve a data analyst in reviewing your segmentation, or discuss your implementation plan with IT and business colleagues. This will enrich your learning and ensure your solutions are realistic. After finishing the assignments, take time to reflect on what you learned and how you can apply these new skills to actual projects in your organization. Each exercise is a stepping stone toward becoming a more data-driven leader. Keep challenging yourself with new data scenarios, and soon you will not only understand analytics – you will actively drive innovation and strategic decisions using analytics in your business environment.
Continuous improvement tip: Consider maintaining a personal “analytics journal” as you do these assignments, noting what worked, what was challenging, and any new questions that arose. This habit will help you track your progress and identify areas for further growth. Embrace these practical experiences, and don’t hesitate to iterate on your approaches – the best learning often comes from trying, refining, and trying again. Good luck, and enjoy the journey of turning data insights into decisive action!
Comments